Export Reports
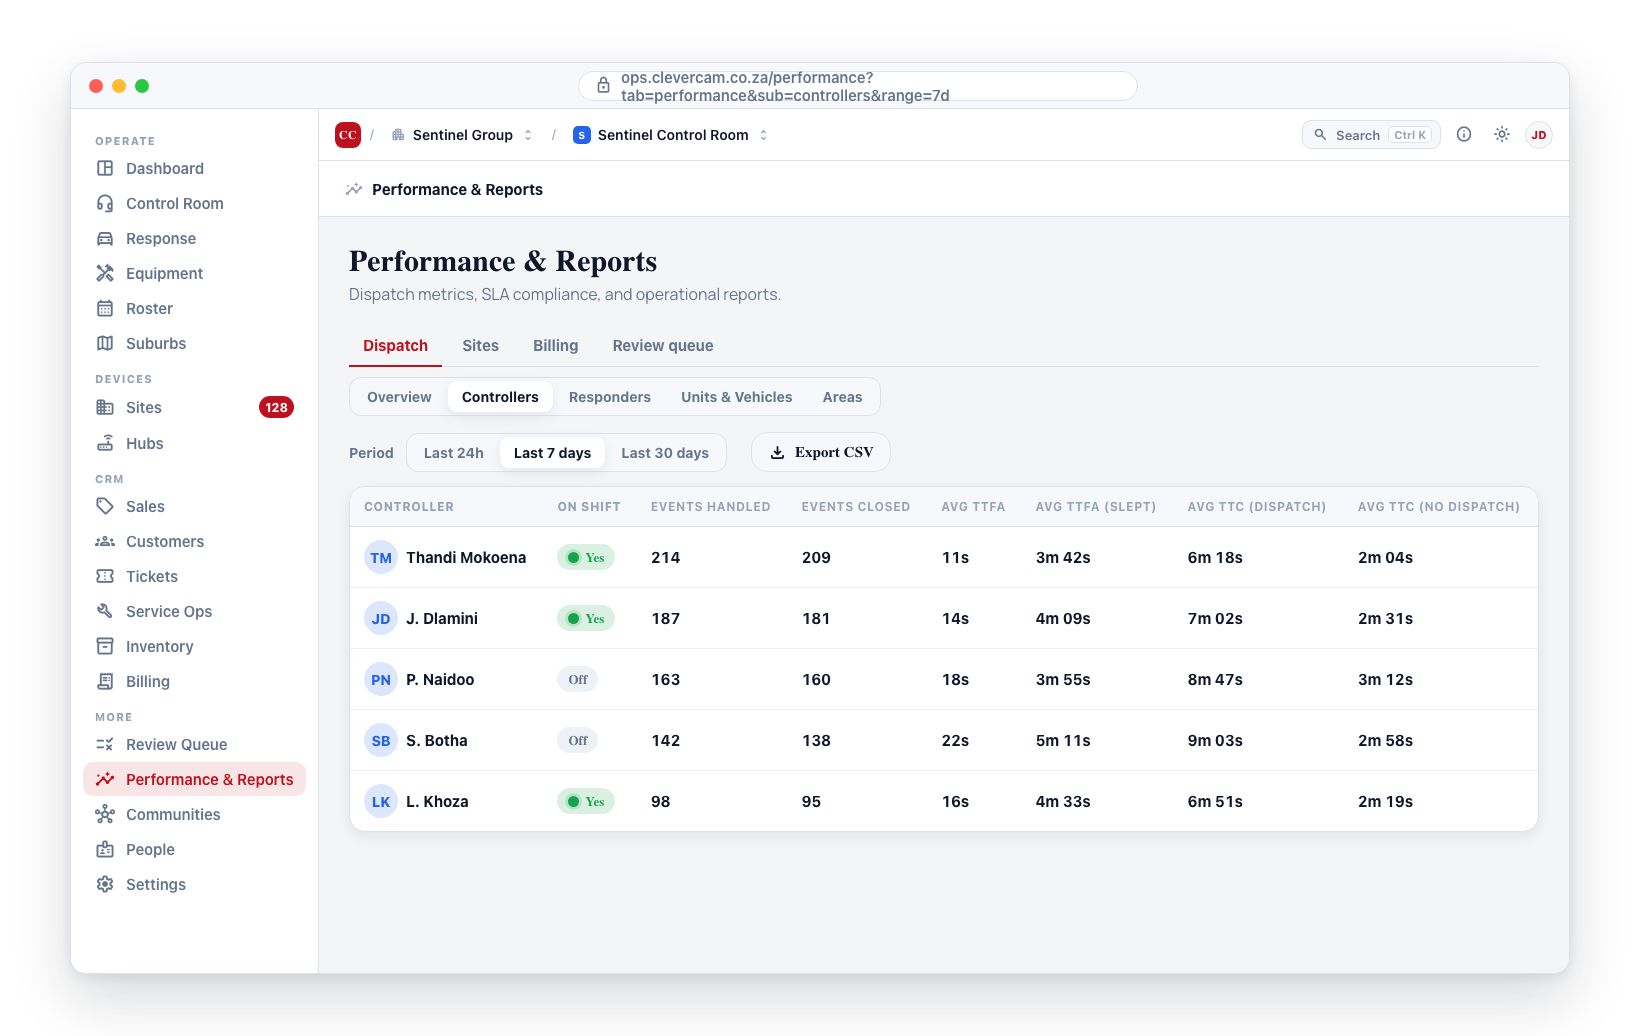
CleverOps supports exporting data from the Performance & Reports page. A PDF export is available on the Billing tab, and a CSV export is available on the Dispatch > Controllers sub-tab.
Billing PDF
The Billing report exports a landscape PDF table of site billing data.
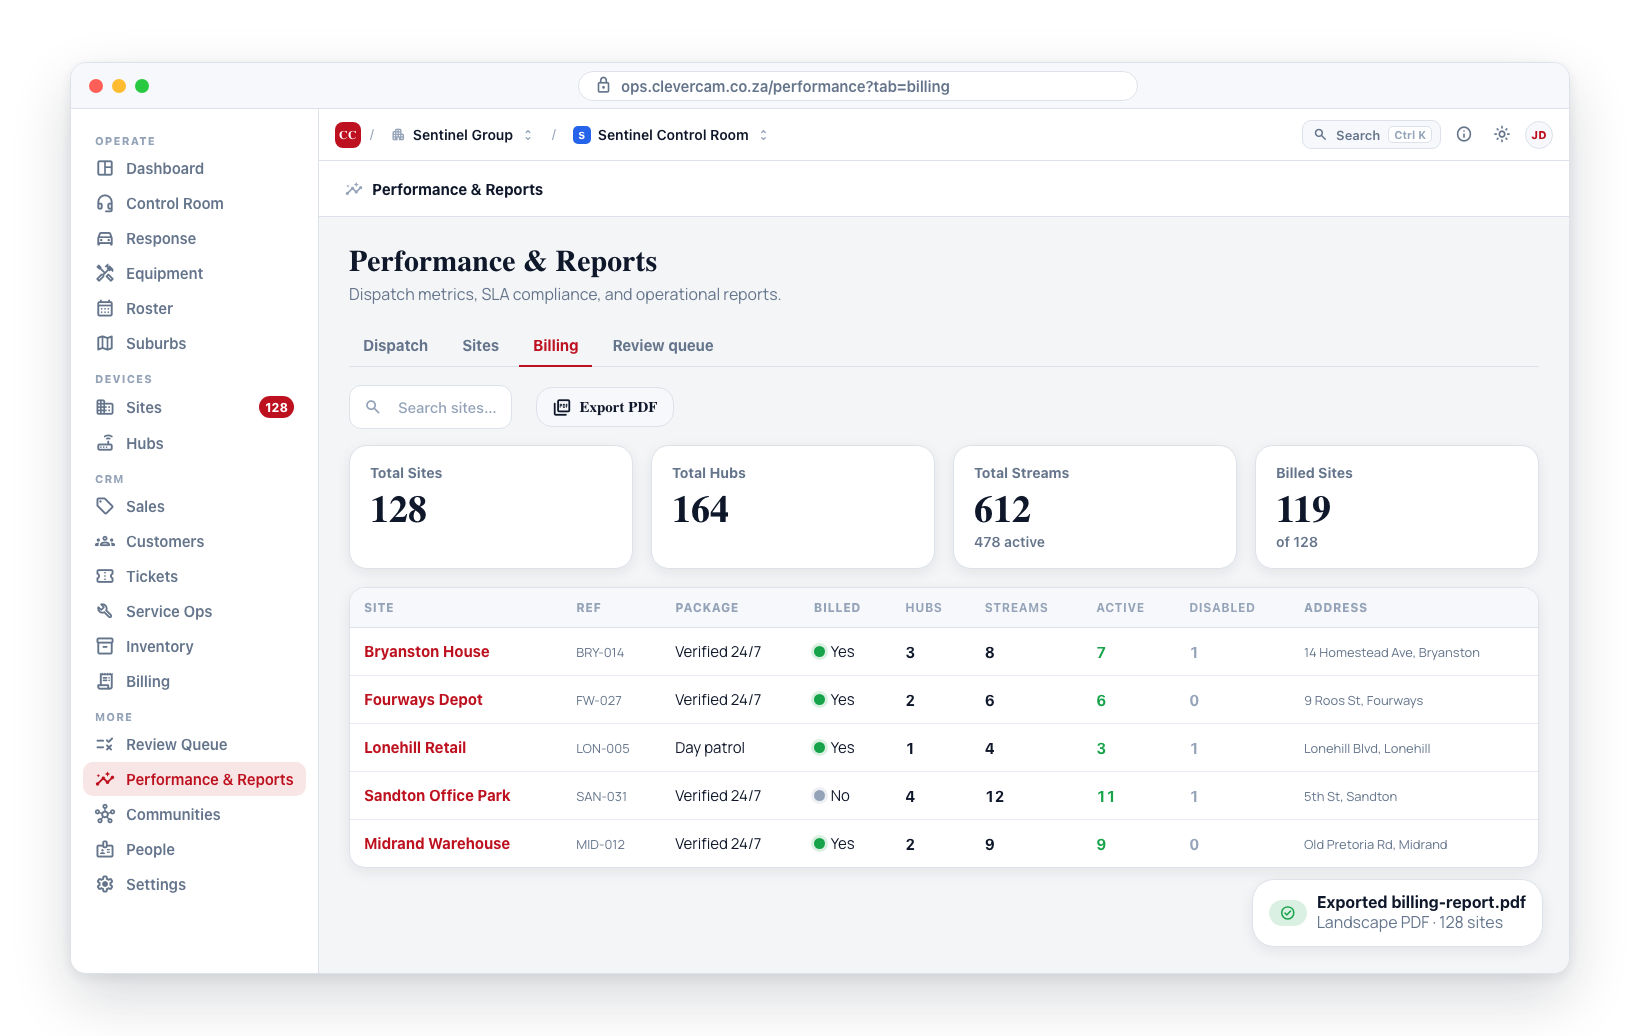
How to Export
- Navigate to Performance & Reports in the sidebar.
- Click the Billing tab.
- Click the Export PDF button. While the report is being generated the button shows Exporting… and is disabled to prevent a double-click.
- The report downloads automatically as
billing-report.pdf, and a confirmation toast appears (a red error toast is shown instead if generation fails).
Report Contents
The PDF table includes these columns:
- Site -- The site name
- Ref -- Your company reference
- Package -- The monitoring package
- Billed -- Whether the site is flagged as billed (Yes/No)
- Hubs -- Total Clever Hub count
- Hubs Online -- How many Clever Hubs are currently online
- Streams -- Total camera stream count
- Active -- Number of active streams
- Disabled -- Number of disabled streams
- Address -- The site's physical address
Controllers CSV
The Dispatch > Controllers sub-tab also offers a CSV export of the per-operator metrics table (named controllers-<range>-<YYYY-MM-DD>.csv). Like the Billing PDF export, the button shows Exporting… while the file is built and raises a confirmation toast on success or an error toast on failure. See Metrics Overview > Totals row + CSV export for the column list.
Reports tab
The Reports tab generates downloadable reports on demand and keeps a history you can re-download. Unlike the per-tab PDF/CSV exports above, these reports are built by the server and stored, so the same file can be downloaded again later.
How to generate a report
- Navigate to Performance & Reports in the sidebar.
- Click the Reports tab.
- Choose a report from the dropdown, then choose a format — CSV (spreadsheet) or PDF (printable table).
- Set any filters the report offers (see Filtering & slicing below) — for example a date range, a suburb, or an alarm type. Filters left blank apply no restriction.
- Click Generate report. The button shows Generating… while the report is built; a toast confirms when it is ready (with the row count) or shows an error if it fails.
- The report appears at the top of the history table — click Download CSV / Download PDF to download it, or Email to send it.
Filtering & slicing reports
A filter bar appears under the report dropdown showing only the slicers the selected report supports. Every slicer is optional — leave it on its default to apply no restriction — except Site, which a per-site report needs before it can run.
- Range — the look-back window (Last 7 days through Last 12 months). Applies to the event, performance, responder performance, alarms-delegated, open/close, revenue, statement, work-shift and purchasing-approvals reports.
- Site — the one site a per-site report describes (the site infrastructure report). Type to search your approved sites by name; Generate report stays disabled until a site is picked.
- From / To — a pair of calendar dates (SAST) for the site infrastructure report, in place of the Range look-back. They start on the default the server would use anyway — the 31 days ending yesterday — and the note beside them shows the window that will be used, or why it cannot run yet: the To date must not be before the From date, and the window can be at most 92 days. A To date in the future is clamped to today.
- Suburb — restricts the report to sites in one of your suburbs. Available on every site-based report (sites list, over-active alarms, false alarms, failed to test, keyholders, open/close stats and alarms delegated).
- Alarm type — restricts event-based reports (over-active and false alarms) to one alarm category (Emergency, Malfunction, Routine or Restore). A CID pattern box beside it narrows further to specific signal codes — type an exact code (
E130) or a wildcard pattern (E13%matches all E13x burglary codes). - Month — the month for the month-end billing report (defaults to the current month).
- Customer — limits the statement report to a single customer (default: a company-wide statement across all customers). It is a search box, not a list: type part of the customer's name, account, contact, phone, email or address and pick from the matches. Closed customers are found too. All customers clears it.
- Billing entity — only shown on a control room that issues from more than one billing entity, and only for the debtors report. All entities — combined gives one row per customer with every entity's debt added together; All entities — a row per entity gives one row per customer per entity with an Entity column, a customer's rows kept together; <Entity> only narrows the report to that entity's invoices and names the entity in the PDF title.
Available reports
Reports export as CSV or PDF (choose with the format dropdown). Document reports — today the site infrastructure report — are always a PDF, and the format dropdown is pinned to PDF while one is selected. The dropdown lists only the reports your control room can actually produce — entries marked AAH need Advanced Alarm Handling (they are built from dispatch records) and entries marked CRM need the CRM module. Everything else is core and always offered.
Core reports:
- Sites / clients list — every monitored site for the control room, with its customer, monitoring package, mode, approval/billed flags and status. Filter: suburb.
- Sites by siren connection — every site with how many of its cameras sound the siren on a verified detection, and whether the site has any siren-enabled camera at all. Filters: suburb, siren status (with / without).
- Over-active alarms — sites generating the most events over the range (5 or more), to surface nuisance sites. Filters: range, suburb, alarm type.
- False alarms — events resolved as false alarms over the range, counted per site. Filters: range, suburb, alarm type.
- Failed to test — hubs that have not reported in over 24 hours (sites whose check-in has gone quiet). Filter: suburb.
- Site infrastructure report — camera feed availability, links, LAN vs internet, outages — for one site, as a PDF. Filters: site (required), From / To dates. PDF only. What the PDF contains is described under Site infrastructure report below.
- Keyholder list — all keyholders and contacts for the control room, with their site, role, phone numbers and call order. Filter: suburb.
- Open / close stats — per-site open/close punctuality over the range: how many days the site closed late, opened early, and its overall on-time %, measured against each site's operating hours. Filters: range, suburb.
Dispatch reports — require Advanced Alarm Handling:
- Operator / agent performance — per control-room operator over the range: total actions, resolves, calls, dispatches, escalations, notes, mean time-to-acknowledge / resolve, and online time. (The same figures power the CleverCommand Agents Performance page.)
- Responder / unit performance — per field reaction unit over the range: dispatches, completion rate, mean response and on-scene time, and suburbs covered. (The same figures power the CleverCommand Responder Delegations page.) Filter: range.
- Alarms delegated to responders — every alarm dispatched to a field responder over the range: which site/suburb went to which unit, the operator who dispatched it, the outcome, response time, and whether a responder incident report was filed. Filters: range, suburb.
- Work-shift report — operator and responder activity over the range, bucketed into day and night shift: shifts worked, active time, and actions / dispatches handled. The day/night boundary is the day window on your Control room clock; unset, it falls back to 06:00–18:00. Filter: range.
Finance reports — require the CRM module:
- Debtors (age analysis) — outstanding invoice balances per customer, bucketed by how overdue they are (Current / 1-30 / 31-60 / 61-90 / 90+ days). It counts issued invoices that are still open — draft, void and paid invoices are left out — so its total agrees with the age analysis on the Billing page. Invoices are aged from their due date. The report lists every debtor, however many there are. Filter: billing entity (multi-entity control rooms only).
- Month-end billing — invoiced, collected and outstanding totals per customer for a chosen month. Filter: month.
- Revenue (recurring vs one-time) — net revenue over the range split into recurring (subscriptions) vs one-time (manual line items and service jobs), grouped by department and product. Filter: range.
- Customer statement — the account ledger (invoices, payments, credit notes and transfers) with a running balance, company-wide or for a single customer. Filters: range, customer.
Inventory reports (core):
- Purchasing approvals — every approval level signed or sent back over the range, in three stacked scopes: all documents, then per kind (purchase orders, supplier bills, payment runs, supplier changes), then per person — levels signed and sent back, signed as delegate, after an escalation or as an override, the median and longest hours a level waited, and what is open now past its reminder. See Approvals → The report. Filter: range.
More report types are added over time; each appears in the dropdown as it ships.
Site infrastructure report
A per-site PDF answering "is this site's camera infrastructure healthy, and if not, where is the fault?" Pick Site infrastructure report, search for the site, set the From / To window (default: the 31 days ending yesterday; at most 92 days; all times SAST) and click Generate report. The same PDF is one click away on the site itself — see Site details → The Reports card.
The PDF opens with a coverage line stating the date its history starts. Camera-feed history began on 8 September 2026, so a window that ends before that shows no camera data, and one that straddles it covers only the days from that date on.
It then reads, in order:
- Four KPI tiles — internal network packet loss, camera-hours lost on faulty links, CCU connectivity as seen from the cloud, and the availability of the other (non-faulty) cameras.
- Part 1 — Per-camera availability. Every camera on the site with its feed availability and a status: Faulty (below 97 % availability, or 3 or more bad days out of at least 7 observed), Watch (below 99.5 %), or Healthy. Availability is counted only over the days the camera actually has feed history — from 8 September 2026 at the earliest, or from the day the camera was added — so a long window is not padded with days nobody measured. A bad day is a day that lost at least 5 % of its video; the table also shows Loss days, the days with any lost video at all, so a camera that blips for a few seconds every day reads as Watch or Healthy, not Faulty. Lost video comes from the CCU's own record of each camera dropping and recovering. When a hub restarts while a camera is down, older hub firmware can miss that camera's recovery; overnight, the CCU's daily summary (the video it decoded, and the minutes it counted the camera as down) closes the gap, and the affected days (up to 14 back) are recalculated. A report pulled today can therefore show slightly better availability for recent days than one pulled yesterday.
- Part 2 — Link evidence. What points at a bad link rather than a bad camera: cameras that fail in the same hours; ping figures where the CCU measures them; and main-stream vs sub-stream evidence. Both of the latter show as not measured until the hub firmware that measures them has been rolled out to the site's hub. The ping table has one row per address — cameras on one recorder share its address, so they share a row — and its status comes from the ping figures alone: Watch from 1 % loss, 10 ms median or 5 ms jitter, Faulty from 5 % loss, 50 ms or 20 ms jitter.
- Part 3 — Internal network vs internet. Per CCU, from the 8-hourly network monitor: whether trouble sits on the site's own LAN or on its internet link.
- Part 4 — Outage log. Each interval the CCU was offline, with its start, end and duration.
- Recommendations — generated from rules over the parts above (which camera or link to attend to first, and what the evidence says it is). One of them names an address that keeps refusing the video connection (at least 20 refusals, and most of its cameras' failures): something at that address is actively turning streams away, so check the network for another device using the same IP address, and the recorder for a stream connection limit or a restarting streaming service.
The download link is valid for 7 days, and the report can be emailed from the history table like any other.
Emailing a report
Click Email on any ready report to send it (with the file attached) to one or more recipients:
- The recipient list is pre-populated with your company team members (the staff on your company that owns this control room). These reports are internal operational documents, so they go to your own people — not to customers or end users. Tick whoever should receive it.
- Add any other address in the custom email field and press Add.
- Optionally add a short message.
- Click Send — a toast confirms delivery.
The report is attached in whichever format it was generated (CSV or PDF).
Once sent, a small indicator appears next to the Email button showing the delivery status — Sent, Delivered, or ✉ Read HH:MM once the recipient opens it (and Bounced if it could not be delivered). Hover it for the full timeline: recipient, sent / delivered / first-opened times and how many times it was opened. The same read tracking applies to invoices, quotes and incident reports. Read detection depends on email open-tracking being enabled for your sending domain.
History & expiry
Every generated report is listed with its format, status (Processing, Ready, or Failed), row count, generated time and expiry. Download links remain valid for 7 days, after which you can simply regenerate the report. The list is scoped to your control room.
The Billing tab exports a PDF; the Dispatch > Controllers sub-tab exports a CSV; the Reports tab generates stored CSV or PDF reports you can re-download for 7 days.
Reports may contain sensitive operational data including site names and billing details. Handle exported reports according to your company's data security policies.