Site Quality
The Site Quality dashboard gives the operator a single-glance view of the health and behaviour of every site the selected VCR monitors. It surfaces patterns that aren't urgent enough to go on the live event queue but are valuable for customer-management conversations — repeated zone bypasses, noisy false-alarm sites, customers who keep getting their password wrong, and cameras that have gone offline.
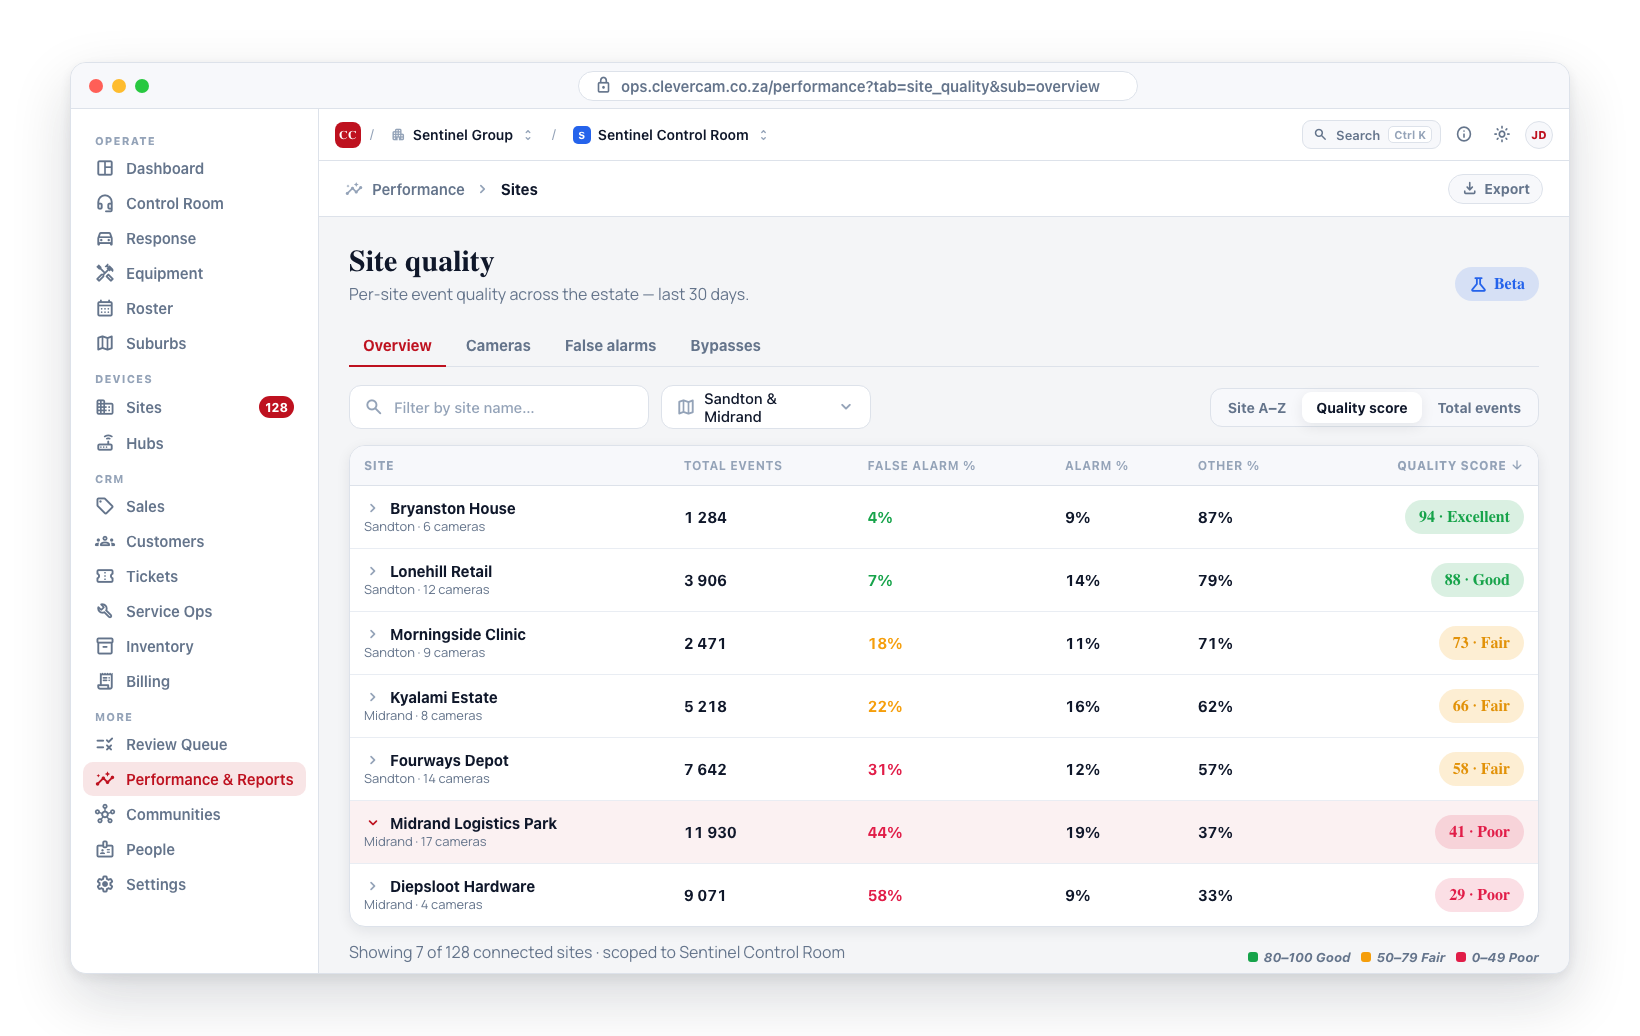
Accessing Site Quality
- In the left sidebar, click Performance & Reports under the Insights section.
- Switch to the Sites top-level tab (between Performance and Billing).
- The Sites tab opens with four sub-tabs: Overview (default), Cameras, False alarms, Bypasses. The Overview is the cross-cutting site-quality dashboard described below; the other three are focused drill-downs on a single signal type.
- All numbers refresh on every tab visit — no nightly aggregation, the metrics are computed live from event and dispatch data.
The legacy URLs /site-quality and /performance?tab=offline both redirect to /performance?tab=site_quality&sub=overview — old bookmarks still work.
The four Sites sub-tabs at a glance
| Sub-tab | What it shows | Use it when |
|---|---|---|
| Overview | Per-site row with all 8 quality columns (events, dispatches, false-alarm rate, bypasses 7d/30d, wrong-password, cameras offline). Inline expandable detail strip per site. | "Show me the sites that need attention." General triage. |
| Cameras | Per-camera row of streams currently offline, showing "Issue detected", flooding with detections in the last 24 hours, or with a device-setup problem, grouped by status pill, sortable by site / camera / status. The "Issue detected" pill may carry a specific reason (e.g. Issue detected: Camera login failed, Stream not found, Connection refused) so you can see why, not just that it's broken. | "Which specific cameras are broken right now (or flooding the system)?" Hardware/network triage. |
| False alarms | Sites ranked by 30-day false-alarm rate (only sites with ≥5 dispatches). | "Which customers are burning operator time on noise?" Customer coaching / billing conversations. |
| Bypasses | Per-(site, zone) row of zones bypassed in the last 30 days, sortable by count or recency. | "Which zones keep getting bypassed instead of fixed?" Sensor / customer-misuse follow-ups. |
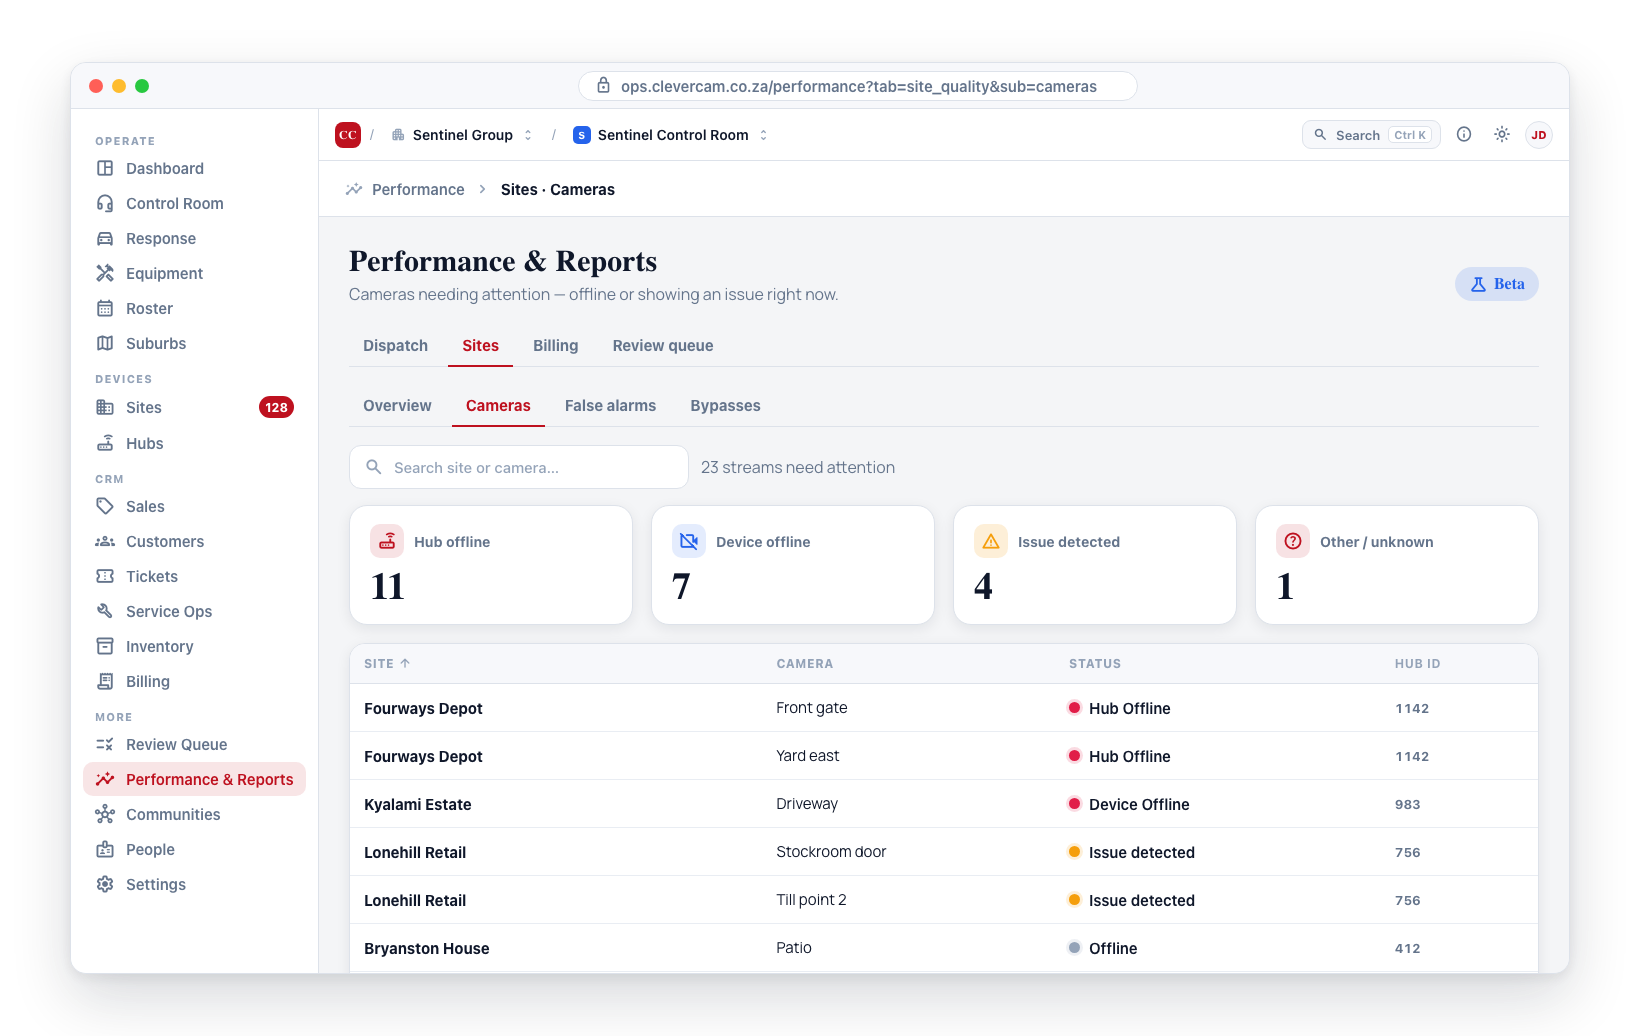
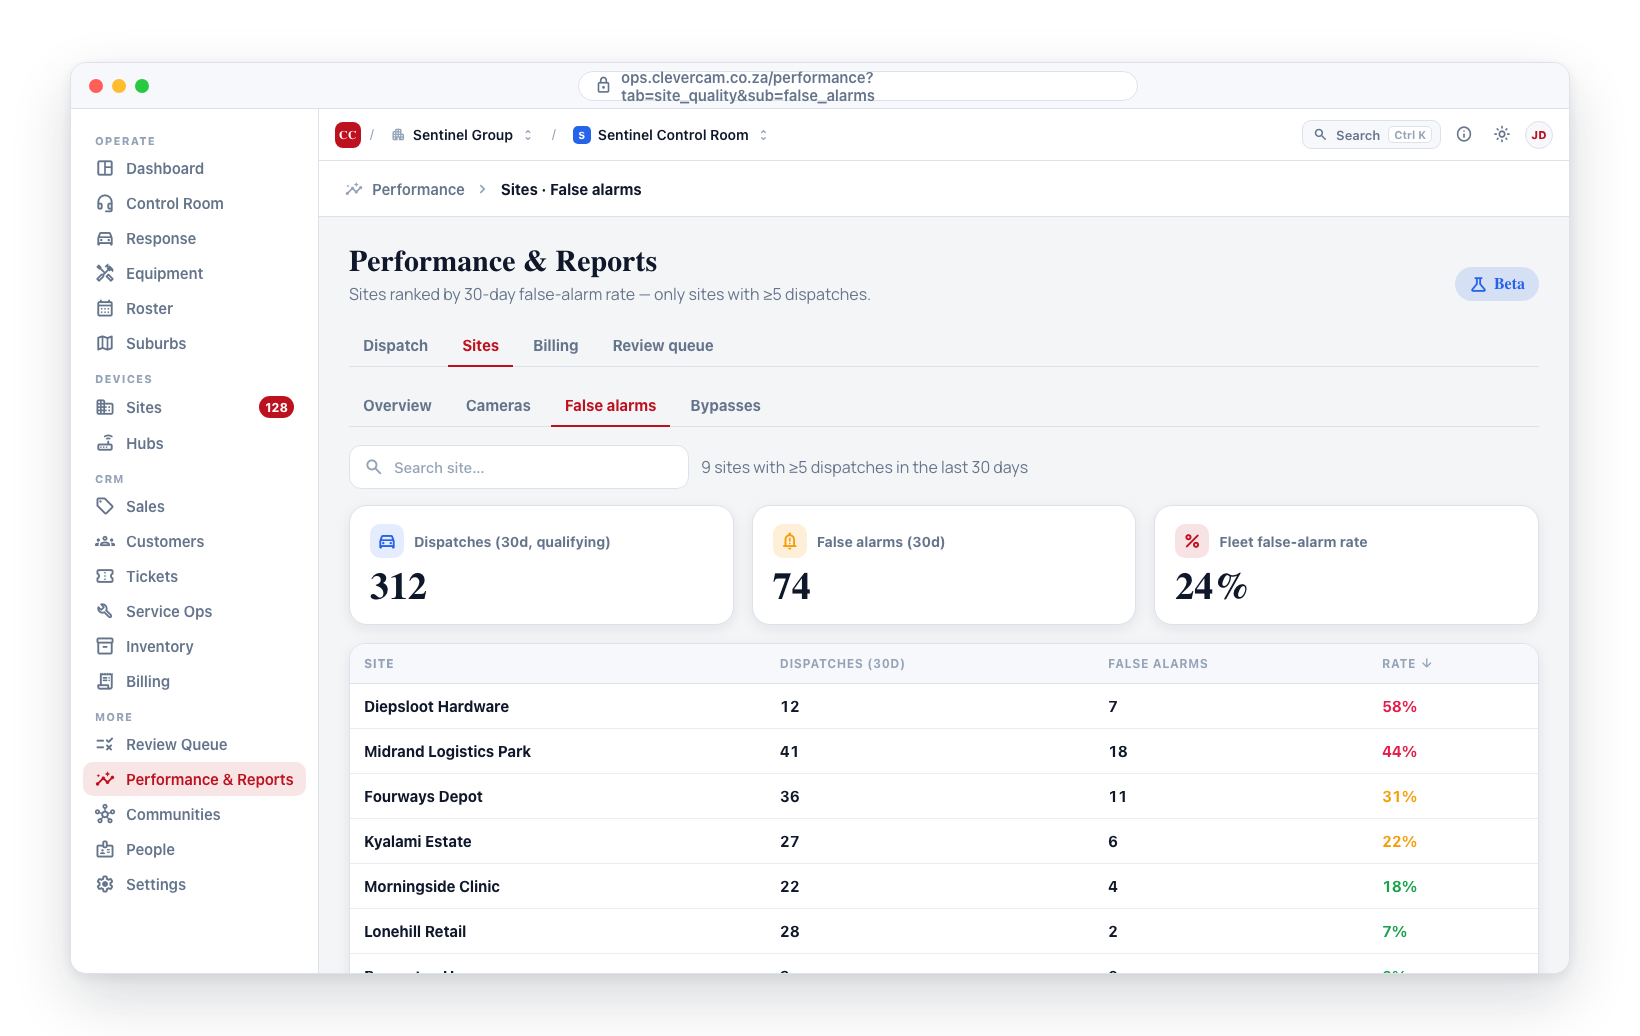
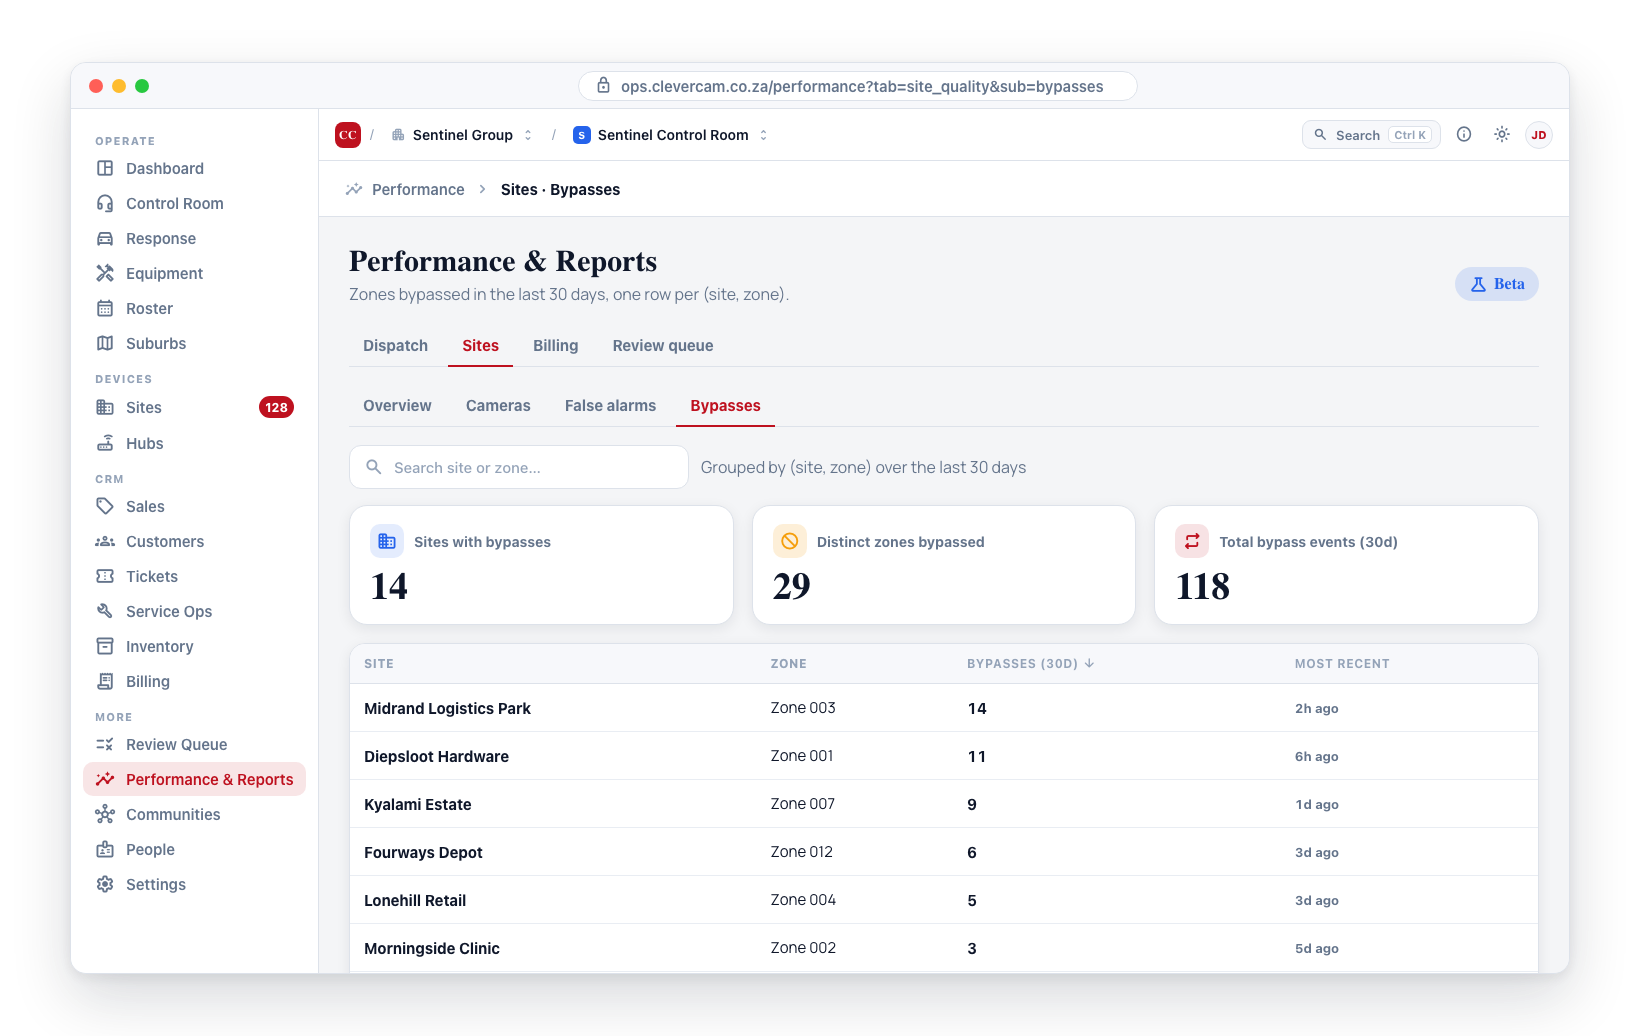
Flooding cameras
The Cameras sub-tab also pulls in streams that hit the detection burst cap in the last 24 hours — CleverCam's term for a camera flooding the system with detections, typically a branch moving in frame, an insect on the lens, or a flickering light. Before this, a flooding stream set video_streams.runaway_detected_at in the database but nothing in CleverOps rendered it, so it stayed invisible here no matter how badly it was misbehaving.
A flooding camera is the inverse of an offline one: it's online, reporting a fresh snapshot, and often carries a perfectly healthy status like "Armed" — so it would never be caught by this sub-tab's offline / stale-snapshot / issue-detected criteria on its own. It needed a signal of its own:
- Flooding detections stat card — a fifth stat card alongside Hub offline / Device offline / Issue detected / Other, counting streams flagged in the last 24 hours. It's counted independently of the other four, so a stream can count toward both Flooding detections and, say, Device offline at the same time (flooding earlier, then dropping offline later).
- "⚠ Flooding" badge — shown next to the status pill on any flagged row.
- Status fallback — if a flagged stream's status column is empty, the row reads "Flooding detections" instead of the misleading "Offline".
The badge (and the stat card count) clears on its own once 24 hours pass without another burst-cap hit — there's no manual dismiss action. The same "⚠ Flooding" badge also appears on the stream's row in the site modal's Hardware tab, beside the Talk / Siren / Strobe deterrence badges.
See Event Burst Bounds for what actually sets the flag, and why the cap is 200 detections.
Device setup problems
Some cameras report their own setup: whether motion detection is switched on in the camera, whether it has an SD card and is recording, what resolution it streams at compared with what its sensor can do, and whether its clock is right. Today that is Dahua Direct cameras and recorder channels (see Dahua Direct: Device health); other cameras simply show nothing here.
A camera with a setup problem is usually online, with a fresh snapshot and a healthy status, so the other criteria never catch it. The Cameras sub-tab pulls it in anyway:
- Device setup stat card: counts streams whose device health has a warning or a problem. A stream that is also offline counts in both.
- Device issue badge: next to the status pill. It is red ✖ for a problem (for example motion detection switched off, which means the camera can never raise anything) and amber ⚠ for a warning (no SD card, streaming far below the sensor's resolution, clock wrong). One issue shows its name; several show a count. Hover it to list them.
- Dot colour: a row whose status is otherwise healthy takes the badge's colour, so it does not read as fine.
The same badge appears on the camera's row in the site modal's Hardware tab. Open the camera's Edit dialog for the full Device health panel, which explains each check, offers Fix on camera for what CleverCam can change remotely, and gives the on-site steps for the rest. The badge clears on its own once the camera's next check comes back clean; there is no dismiss action.
What's on the page
Summary tiles
Three headline numbers at the top, summed across every site this VCR monitors:
- Bypasses set (7d) — total zone bypasses set in the last 7 days.
- Wrong-password attempts (30d) — total times a customer entered the wrong password in the last 30 days.
- Cameras offline (now) — current count of offline cameras.
Per-site table
One row per site, with these columns (all sortable — click a column header to sort, click again to flip direction). The table sorts by Events (30d) descending by default — busiest sites at the top.
- Site — the site name with a
▸/▾chevron. Click any row to expand a detail strip below it (see Row drill-in) — click again or click another row to collapse / switch. - Events (30d) — total events sent for this site in the last 30 days, across all event types (alarms, openings, bypasses, tampers, etc.). The raw "how busy is this site?" denominator behind every other metric. A site with 60k events in 30 days but zero dispatches is usually a hub spamming events that aren't being routed properly — investigate.
- Dispatches (30d) — completed dispatches in the last 30 days. The number of times a unit was actually sent. Low for self-monitoring sites, high for premium full-monitoring sites.
- False alarm rate (30d) — the share of completed dispatches that ended with
outcome='false_alarm'. Only shown when the site had at least 5 dispatches (smaller denominators are statistically noisy). High rates flag customers who burn operator time. The detail in brackets shows<false alarms> / <total dispatches>so you can see the absolute counts. - Bypasses (7d) — number of zone bypasses set in the last 7 days, with the top zones called out (e.g.
Z001×4, Z003×2). High counts often mean a broken sensor or a customer working around a zone instead of fixing it. - Bypasses (30d) — same metric over a longer window, useful for spotting patterns that don't show up in 7 days.
- Wrong password (30d) — number of times a customer typed the wrong password during the last 30 days, with the count of distinct contacts in brackets. A high rate per contact often means the contact has the wrong password saved or needs a reset.
- Cameras offline — current offline count over total camera count for the site (e.g.
3 / 12). A site with many cameras offline is likely a hub-down situation that needs technician attention.
Filtering
Use the search box at the top of the tab to filter the table by site name. The summary tiles always reflect the full unfiltered set so you keep the broader context.
Row drill-in
Clicking any row toggles an inline detail strip below the row showing three columns of per-site context. The strip lazy-loads its data on first open and caches it for the rest of the session — re-opens are instant.
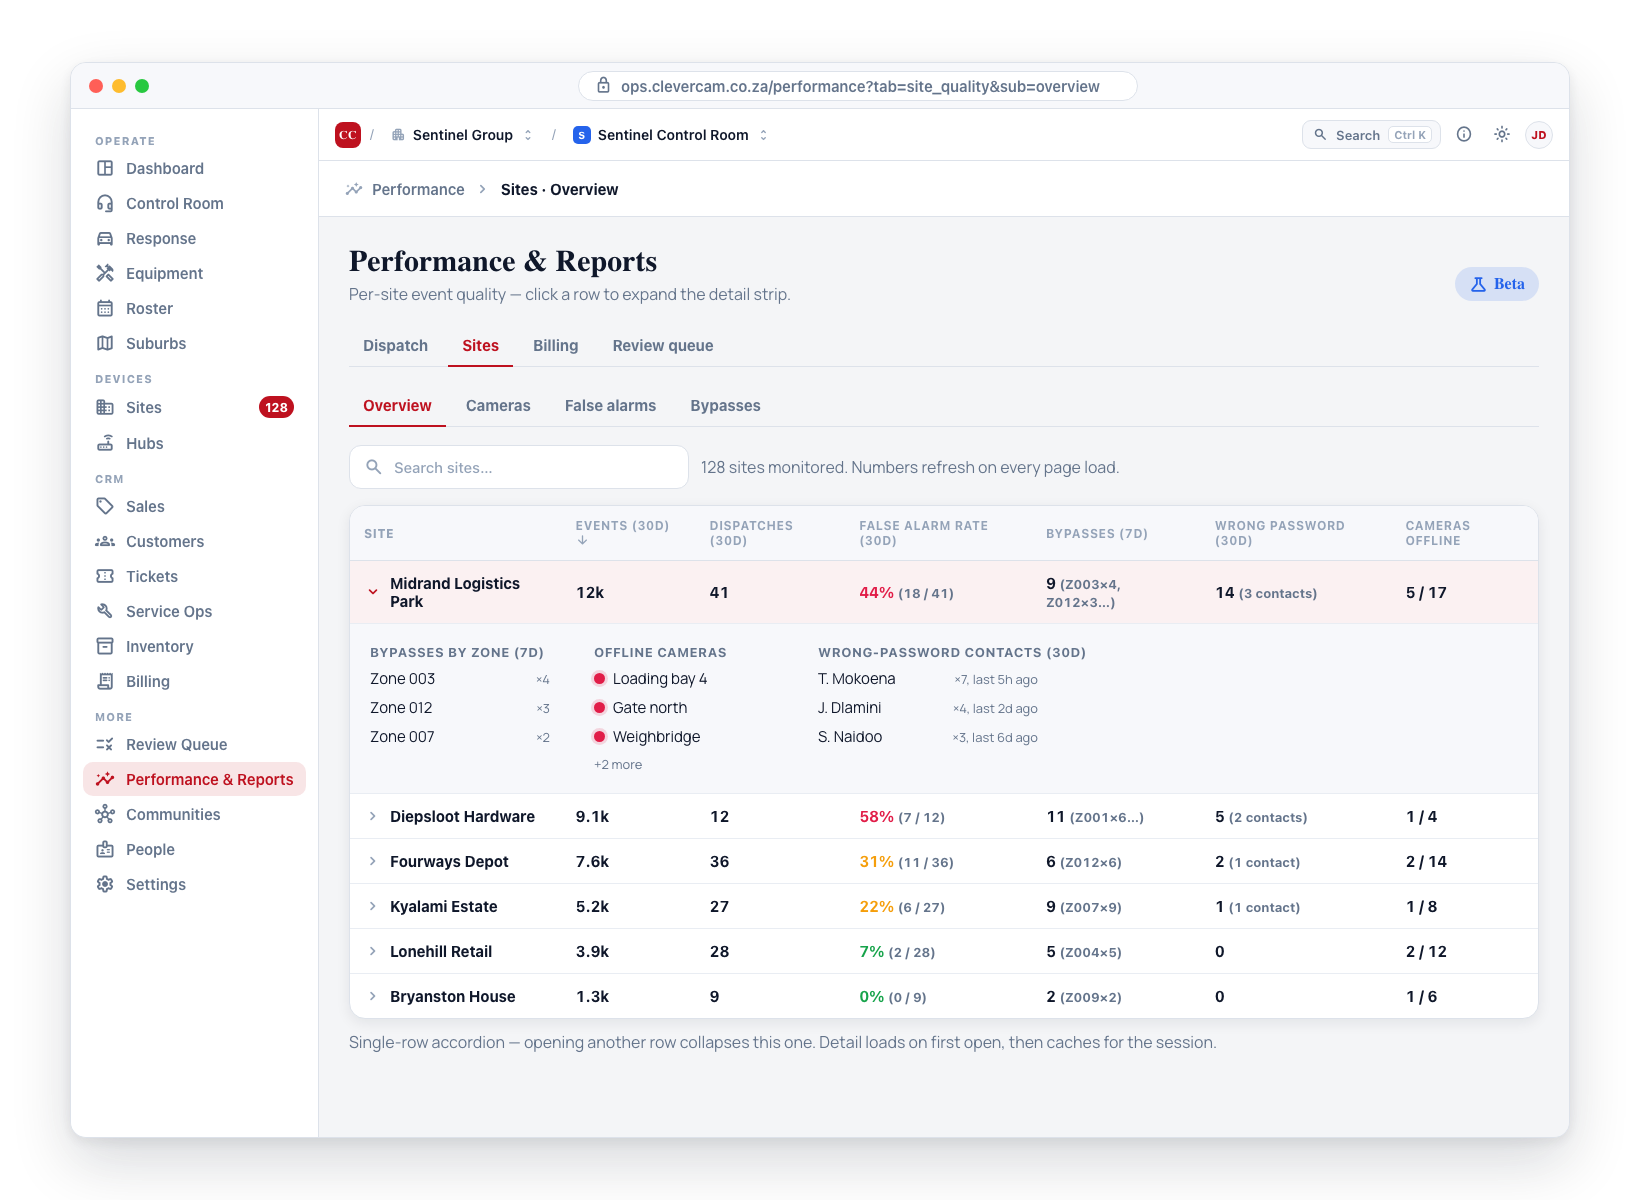
- Bypasses by zone (7d) — full per-zone breakdown of bypass-set events in the last 7 days. Up to 10 zones, sorted by count descending. Comes from the same
bypasses_per_zone_7dJSON in the row, so no extra query is needed for this column. - Offline cameras — list of stream labels currently in a troubled state for the site: a
Hub Offline,Device Offline, orIssue detectedstatus, or no fresh snapshot in the last 24 hours (snapshot_update_timeabsent or older than 24h), excluding admin-disabled streams. Up to 10 names; if there are more, a+N moreline appears. - Wrong-password contacts (30d) — for each contact who failed at least once in the last 30 days: their name, attempt count, and how long ago the most recent attempt was (
5h ago,2d ago, etc.). Sorted by attempt count descending.
Single-row accordion semantics: opening a new row collapses any previously open row. If you find yourself wanting multiple rows open at once, file a request — the underlying state is a Set and easy to switch.
How to use it
The dashboard surfaces signal — it doesn't take action. Common workflows:
- Sort by Events (30d) descending (the default) to spot the noisiest sites. Cross-reference with Dispatches: high events + low dispatches usually means a hub that's spamming alerts that aren't routing properly — likely a misconfigured camera or a stuck sensor.
- Sort by Bypasses (7d) descending to find sites with the most active zone-bypass behaviour. Drill in, look at which zones are repeating, and decide if it's a sensor problem (tech ticket) or a customer-coaching opportunity.
- Sort by False alarm rate (30d) descending to find sites that consume disproportionate operator effort. These are candidates for a billing conversation or a sensor-tuning session.
- Sort by Wrong password (30d) descending to find contacts who consistently fail the password check. If one contact at a site is failing 5+ times in a month, reach out to confirm the password they have on file.
- Sort by Cameras offline descending to find sites with hub-or-network problems. A site showing
15 / 17offline almost certainly has a hub down — proactively contact the customer or dispatch a technician.
Signal sources
Each metric reads live from a different table — there's no separate aggregation step:
- Events —
eventstable, all rows joined bysite_ref, last 30 days. - Dispatches —
vcr_dispatchesrows with non-nulloutcome(i.e. completed) joined to events for site identification, last 30 days. - Bypasses —
eventstable, alarm-panel CIDsE570andE573(zone bypass set), grouped by zone identifier fromfull_metadata.signalZoneUser. - False alarm rate — completed dispatches with
outcome='false_alarm'divided by completed dispatches. - Wrong-password attempts —
management_eventsrows ofkind='wrong_password'(written by CleverCommand when a customer enters the wrong password). - Cameras offline — derived from
video_streams.status(Hub Offline,Device Offline, orIssue detected— matched by prefix, so a status carrying a specific reason such asIssue detected: Camera login failedstill counts) combined with snapshot freshness (snapshot_update_timeabsent or older than 24 hours), excluding admin-disabled streams. The legacyis_onlinecolumn is no longer used — it was unreliable fleet-wide (false for ~96% of streams, including healthy cameras), so this metric now matches CleverAlert's 24h staleness definition.
Limitations and known caveats
- The page is scoped to the currently selected VCR. To compare metrics across VCRs you'd switch VCR via the VCR selector and reload.
- Only sites with
vcr_site_connection.is_approvedenabled show up. Pending approvals are excluded from quality metrics. - The false-alarm rate is intentionally hidden for sites with fewer than 5 completed dispatches in the last 30 days — small samples are misleading.
- "Cameras offline" reflects the current snapshot, not historical streaks. A camera that's been offline for 30 days and one that just dropped count the same. We may add an offline-streak metric in a later iteration.
- Bypass detection requires the alarm-panel webhook to populate
full_metadata.signalZoneUser. Hubs that don't (rare) won't contribute to the per-zone breakdown but will still count toward the site total.