Dashboard Overview
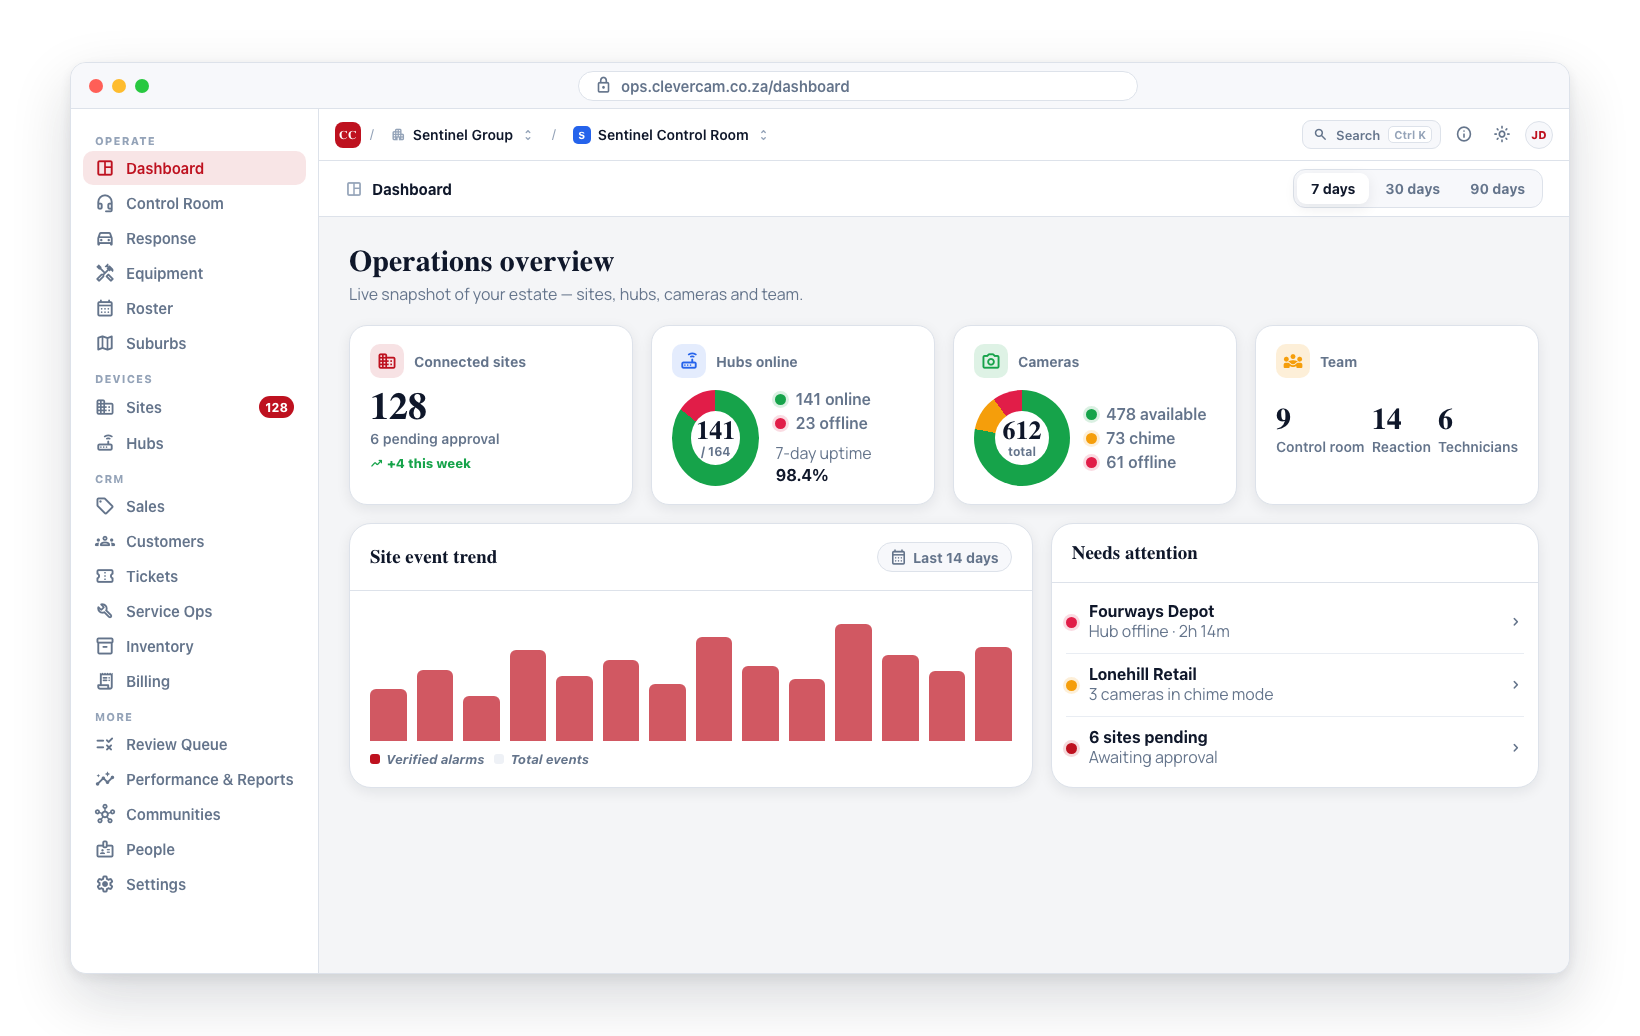
The CleverOps dashboard is the first screen you see after selecting a VCR. It provides a real-time snapshot of your entire operation -- how many sites are connected, which hubs are online, who is in the control room, and how your infrastructure is performing. This page explains each section of the dashboard and what the numbers mean.
Every count on the dashboard is the VCR's true total, no matter how large it grows -- a card never silently plateaus at a fixed row limit. The lists behind the dashboard (and the ops and billing tables elsewhere in the app) also update on their own as records change, so another operator creating a site, a hub coming back online, or an invoice being paid shows up within a second or two without reloading the page.
Dashboard Cards
The dashboard is organized into a grid of stat cards. Each card focuses on a different part of your operation.
Every card belongs to an area of the app, and it shows only if your roles let you open that area from the sidebar — the same rule as Roles and Permissions. Owners and administrators see every card. Someone whose roles unlock none of the summaries sees a short note instead of the grid, and the sidebar still takes them to their own areas.
| Card | Shows for anyone who can open |
|---|---|
| Sites | Sites |
| Hubs & Uptime | Hubs |
| Public Visibility | Settings |
| Cameras | Sites or Hubs |
| Team | Control Room, Response or People — each count on its own, so you may see one, two or all three |
| Alarm Autopilot | Review Queue |
| Expiring soon | VCR settings holders |
| Service ops (jobs, follow-ups, quote reminders, completed) | Service Ops |
| Service ops (ticket reminders, portal requests) | Tickets |
| Service ops (average rating) | Performance & Reports |
| Service ops (revenue, unpaid invoices) | Billing & invoices — a cashier does not see these |
When the selected VCR is still empty — no connected or pending sites and no hubs — the dashboard shows a Get started checklist card instead of empty stats. It walks through four steps, each with a button that jumps to the right screen: Create your first site (Go to Sites), Claim your hub (Go to Hubs), Add your team (Go to Control Room), and Set up your profile (Go to Settings). The card disappears once the control room has its first site or hub. It shows only to people who hold VCR settings — every step on it is a manage action.
Sites Card
Shows two counts side by side:
- Connected -- The total number of sites actively linked to this VCR. Click to jump to the connected sites list.
- Pending -- Sites waiting for approval. Click to jump to the pending sites list.
Hubs & Uptime Card
This wide card combines hub counts with uptime data:
- 7-day uptime donut -- A donut chart in the center showing average hub uptime over the past 7 days as a percentage. The ring is green when uptime is 95% or above, amber when 85--94%, and red below 85%.
- Online / Total -- How many hubs are currently online out of the total.
- Sirens / Total -- How many hubs have a siren connected out of the total.
- Uptime percentages -- Three figures shown below: 24h, 7 days, and 30 days average uptime across all hubs.
Click anywhere on this card to navigate to the Hubs page.
Public Visibility Card
Shows whether your VCR is currently Public or Private, with an inline toggle switch. Flipping the switch asks for confirmation first — Make control room public (people in your regions will be able to find and request to join it in the CleverAlert app) or Hide control room (existing connections keep working) — before the change is saved. The same setting is also editable under Settings → Profile.
Cameras Card
A donut chart that breaks down camera status across your VCR. The center of the donut shows the total camera count. The legend groups cameras by status color:
- Green -- Available, connected, or running cameras.
- Amber -- Cameras in chime or retail chime mode.
- Red -- Armed, updating, syncing, or cameras with issues (device offline, blocked, suspended, unstable, not running).
- Grey -- Hub offline or disabled cameras.
Team Card
Shows three counts for your VCR team:
- Control Room -- The number of control room operators assigned. Click to open the Control Room page.
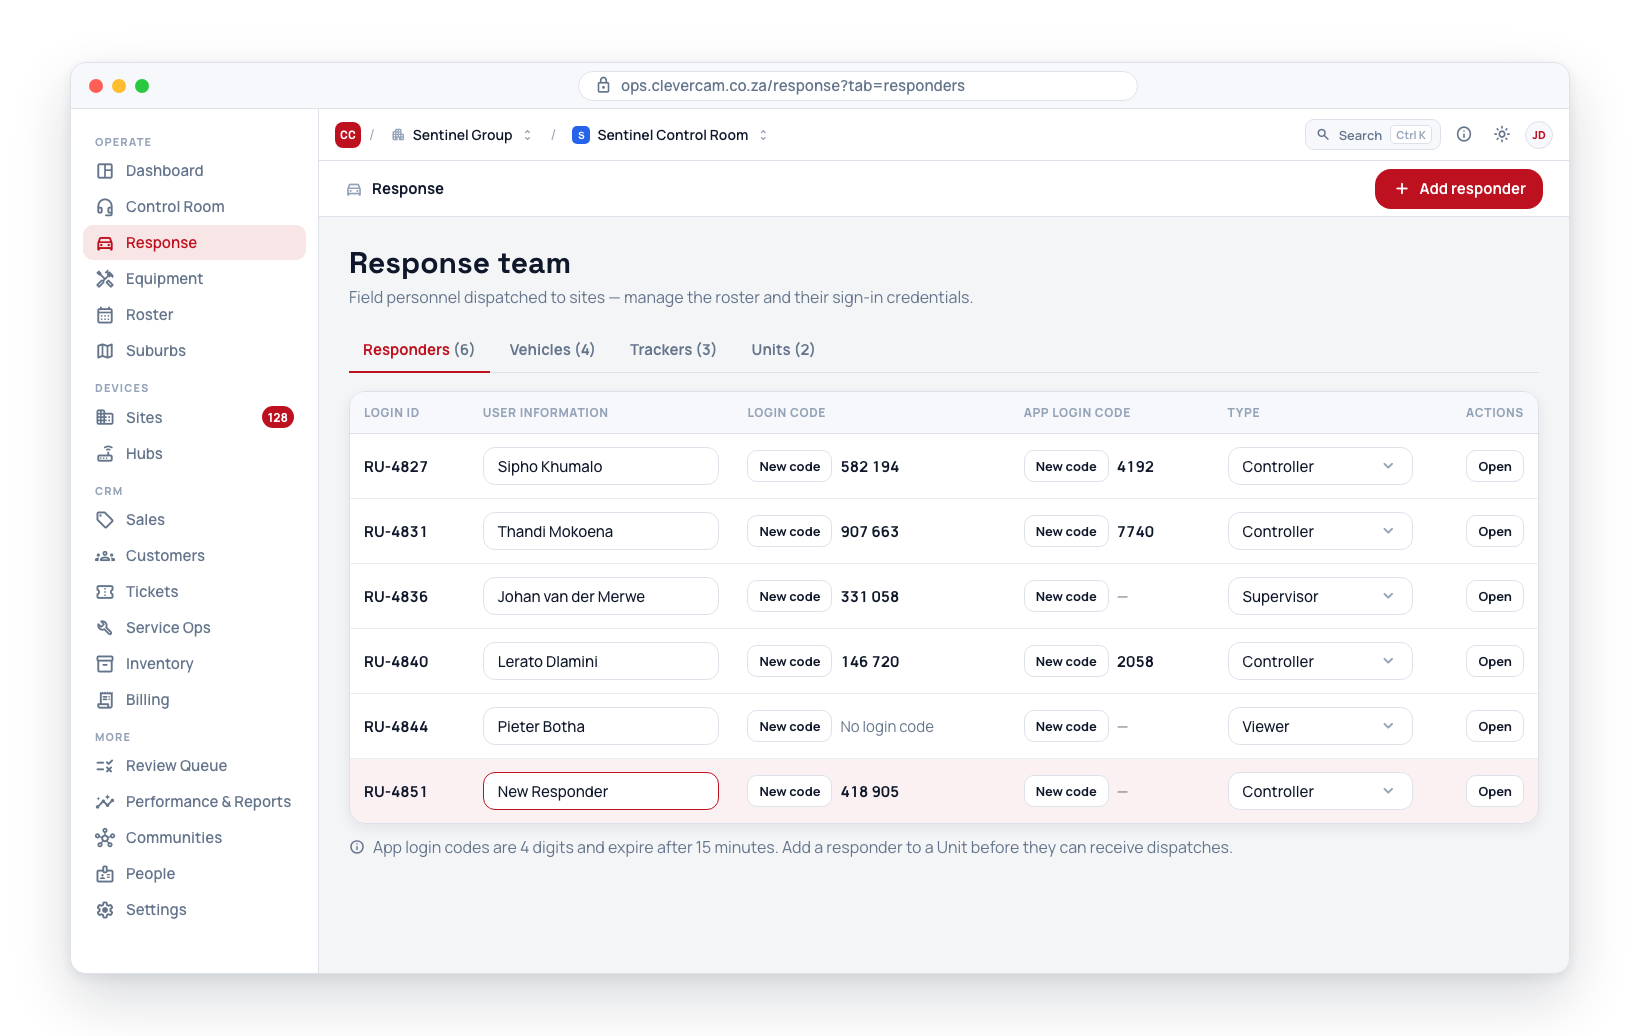
- Responders -- The number of response (reaction) members. Click to open Response on its Responders tab.
- Technicians -- Technical staff who install and maintain hubs. Click to open the People page.
Each of the three is counted independently, so a team member who holds more than one role (for example both control-room and responder access) is counted correctly in every card that applies to them.
Alarm Autopilot Card
Only appears on VCRs where Advanced Alarm Handling is enforcing Action Plans and has actually made routing decisions in the last 7 days -- for everyone else the card is hidden.
The headline figure is the auto-handled percentage: the share of alarm signals in the last 7 days whose Action Plan handled them without a live operator. Next to it, a breakdown by handling:
- Review queue -- Signals diverted to the management review queue for batch triage.
- Notified -- "Log & notify" signals: logged, and the site's primary contact was notified automatically (app push / WhatsApp / email, per their opt-ins).
- Logged -- "Log only" signals: recorded for the audit trail, never surfaced.
- Operator -- Signals routed to the live control-room kanban.
- Auto-closed -- Off-board items that closed themselves when the matching restore signal arrived (for example a power failure followed by a power restore).
Viewing the card requires VCR manage rights; other users simply don't see it.
Expiring Soon
Below the stat cards, an Expiring soon section lists every compliance renewal approaching inside the VCR's reminder window (the same horizon as the weekly reminder email, 6 weeks by default): staff PSIRA registrations, firearm competency and driver's licences, firearm licences and cleaning schedules, and vehicle licence discs, roadworthy, insurance, and service (by date or odometer).
Rows are sorted overdue-first, each with the expiry date and a colour-coded due pill; an item with a logged renewal application shows renewal application in hand. Clicking a row opens the matching register — People, Firearms, or Vehicles. Everything here is driven by the date fields captured on staff profiles, firearms and vehicles — no uploaded document is required for an expiry to be tracked. When nothing falls inside the window the section shows a quiet all-clear line instead.
Like the staff profiles it reads from, this section requires VCR manage rights; other users don't see it.
Top Bar
A slim bar runs across the top of every screen. On the left it shows where you are as a breadcrumb: the CleverOps logo, then your company name, then the current VCR name (with its logo). The arrows next to each name open a switcher dropdown -- pick another VCR to jump straight to its dashboard, or pick another company. The company dropdown also holds All companies, New company, and Join company; the VCR dropdown holds New Virtual Control Room.
On the right of the top bar:
- Search -- opens the global search (you can also press Ctrl+K, or Cmd+K on Mac, from anywhere). Type to jump to any page, or to find a record anywhere in the selected control room. See Search for what it matches. Use the arrow keys to move through the results, Enter to open one, and Esc to close. The last row, See all results, opens the full Search page. Results respect your permissions and the control room's enabled modules -- the search never offers a page or record you couldn't reach from the sidebar.
- Theme toggle -- one click switches between light and dark mode.
- Mentions bell -- shown whenever a control room is selected. Its red count is the number of notes in which a colleague has mentioned you in this control room and you have not yet acknowledged; click it to read each note in full, Open the record, or Acknowledge it on the spot. The count only drops when you acknowledge or reply -- never because you looked.
- Help button -- an info icon that opens a small menu with two links, both opening this documentation site in a new tab: CleverOps guide (the docs home) and Help for this page (the docs page for the area you are currently on). It is available on every page.
- Avatar menu -- your initials open the account menu with your name and email, Account settings, the Super Admin mode toggle and Super Admin link (only for super-admin accounts), and Log out.
Account settings (click your name or the Account settings item) opens your personal account page -- the same profile CleverAlert shows, shared across every company and VCR: edit your first name, last name, and phone number (a country-code selector defaults to +27; type the number with or without the leading 0 -- it is stored in international format), see your sign-in email (read-only -- contact support to change it), and change your password.
Navigation Sidebar
The left sidebar is split into collapsible groups (click a group heading to fold it -- your choice is remembered on your device):
Operate
- Dashboard -- The overview page you are on now
- Control Room -- Operator management and credentials
- Response -- Responders, vehicles, trackers, and units
- Areas -- Geographic zone management
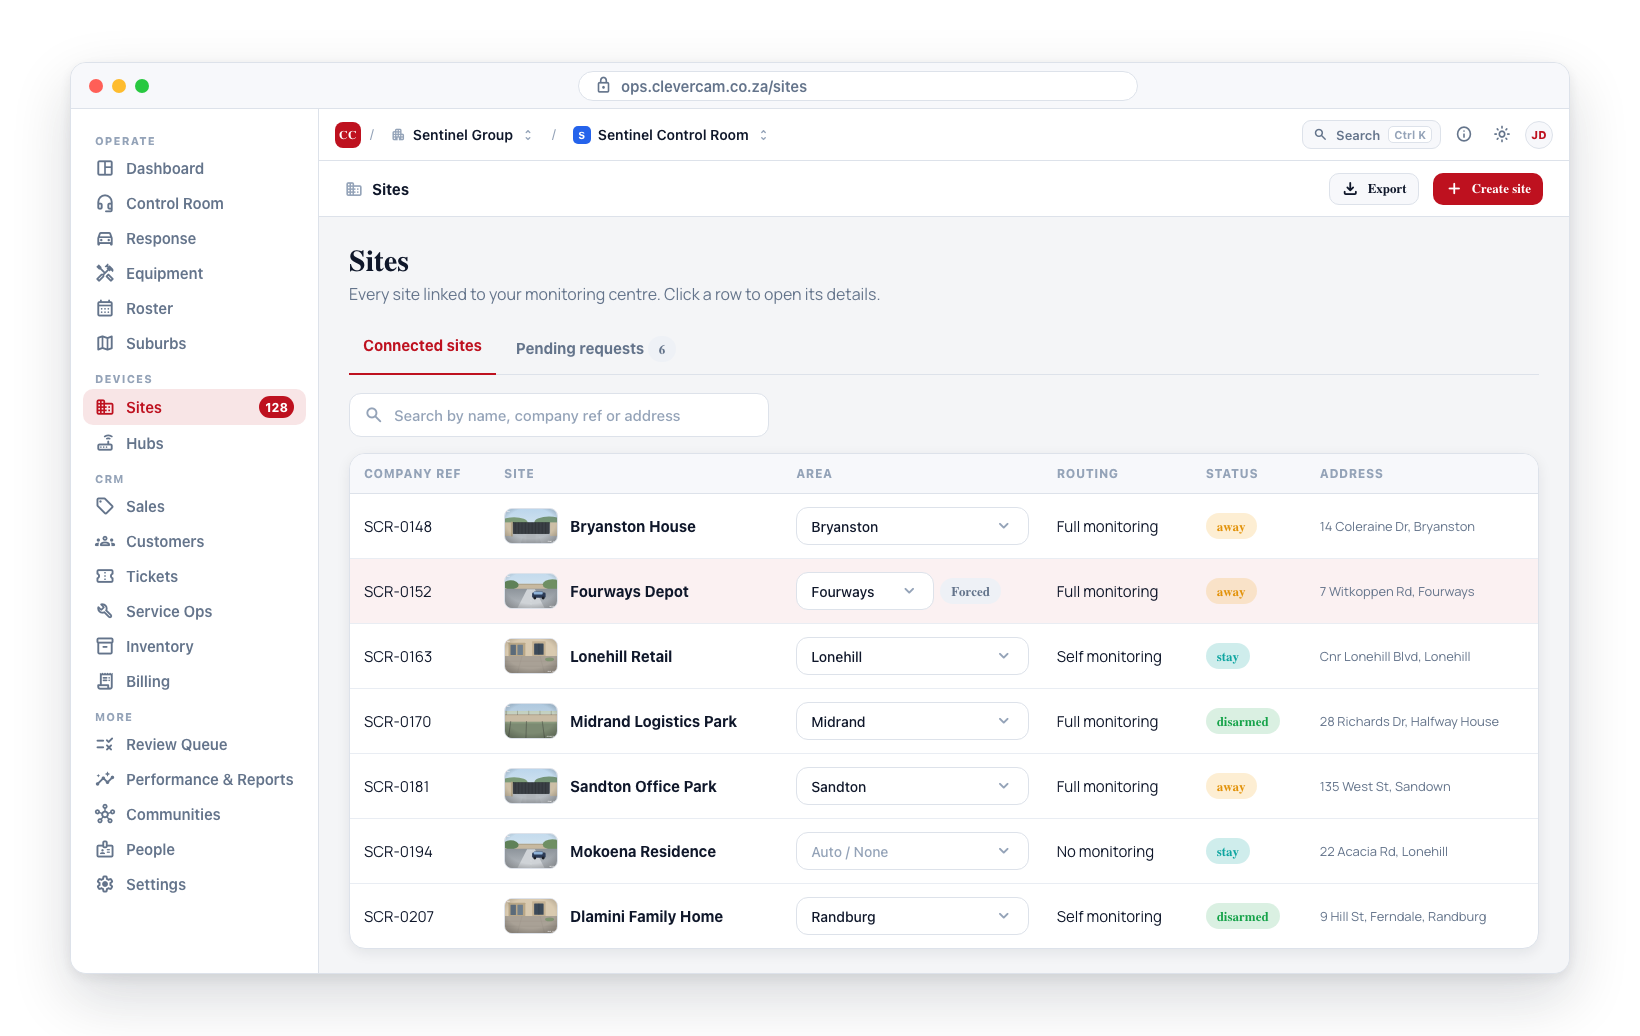
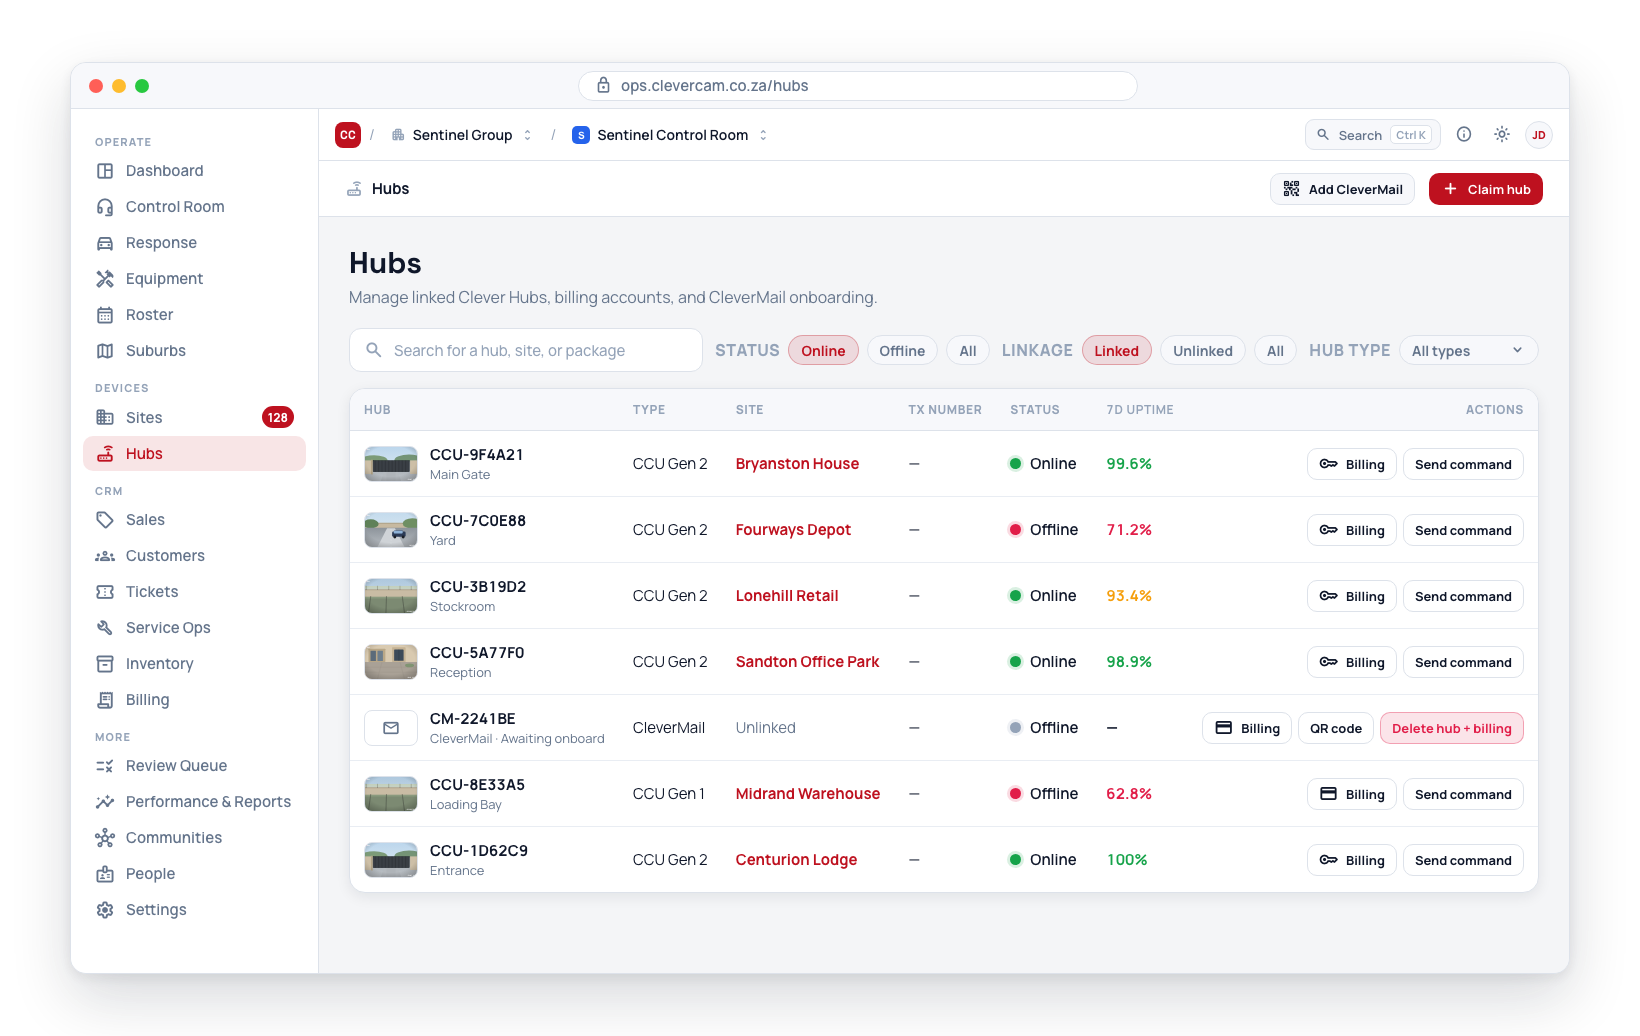
Devices 5. Sites -- Connected sites, pending sites, and site creation 6. Hubs -- Hub management, commands, billing, and QR codes
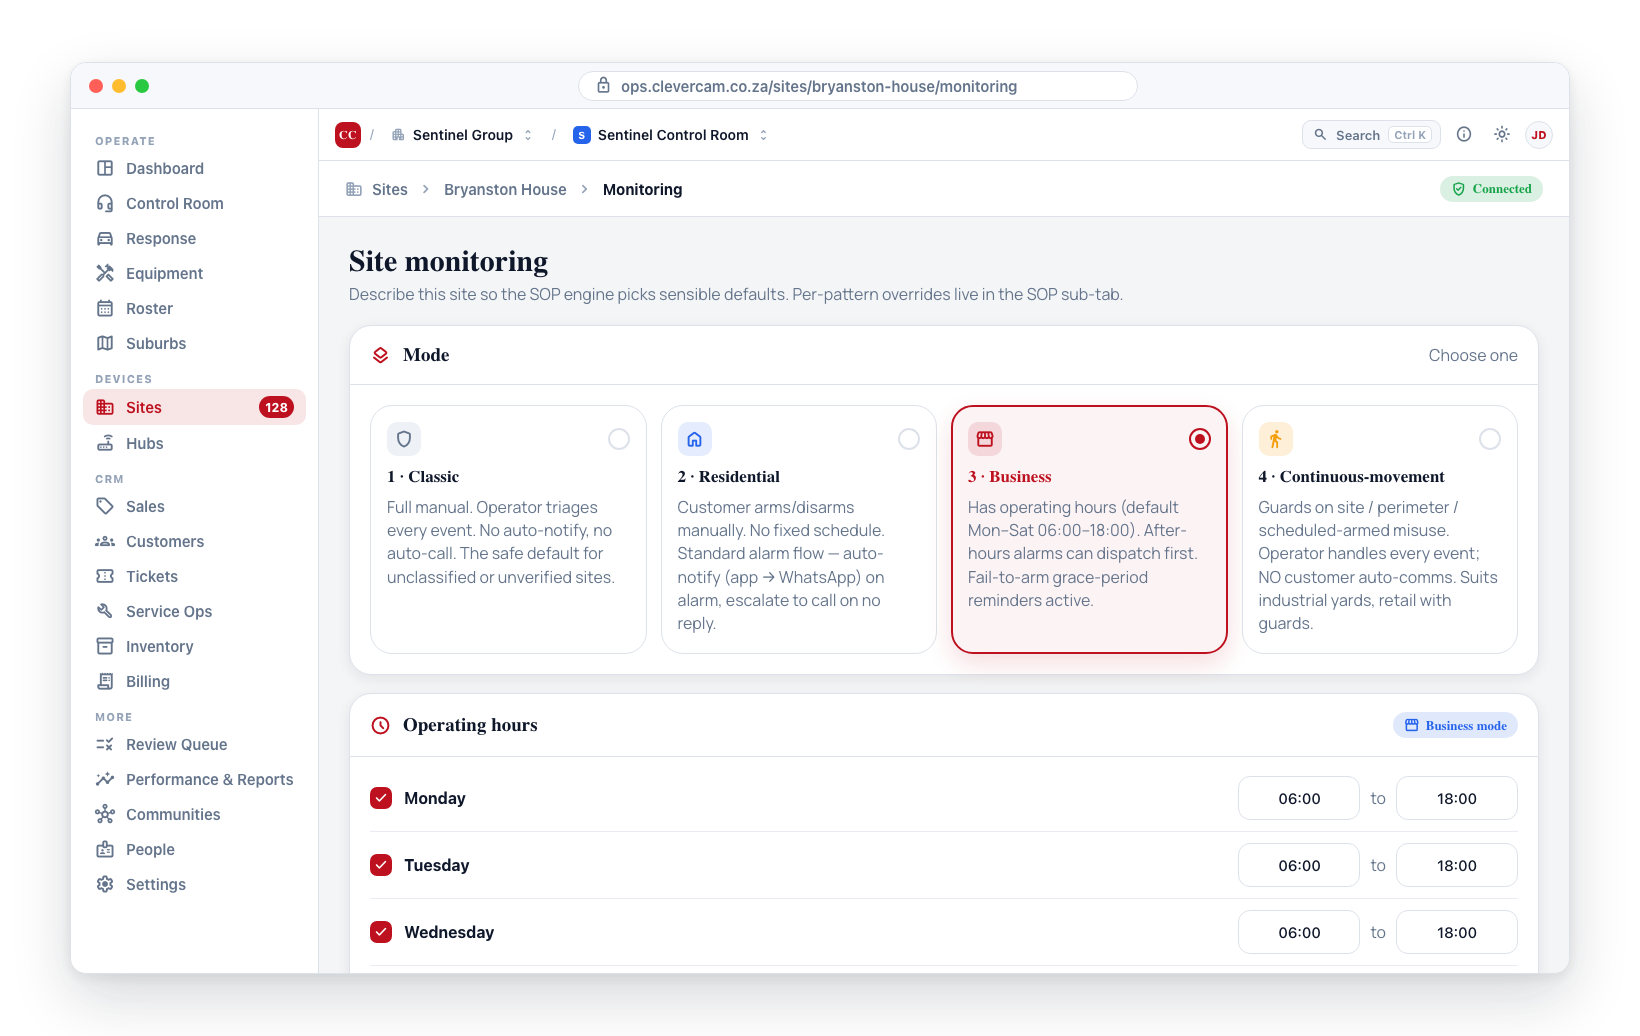
CRM (shown once the CRM module is on for the VCR) 7. Sales -- Leads pipeline, quotes, and the Onboarding board, behind one Overview | Leads | Quotes | Onboarding switcher (Onboarding itself needs its own module too) 8. Customers -- Customer accounts and sites 9. Tickets -- Call-ins, observations, follow-ups 10. Service Ops -- Jobs, schedule board, technicians, catalog, recurring maintenance 11. Billing -- Invoices, subscriptions, payments, statements
More 12. Review Queue -- The Brain's management inbox (Advanced Alarm Handling module) 13. Performance & Reports -- Metrics, heatmaps, SLA, and reports (Advanced Alarm Handling module) 14. Communities -- Neighborhood security networks 15. People -- Everyone in the control room on one list: operators, responders, guards, office staff and technicians, with their roles, access and compliance 16. Settings -- VCR configuration and integrations
On smaller screens the sidebar collapses behind the menu button on the left of the top bar and slides in as a drawer.
Quick Actions
Most dashboard cards are clickable:
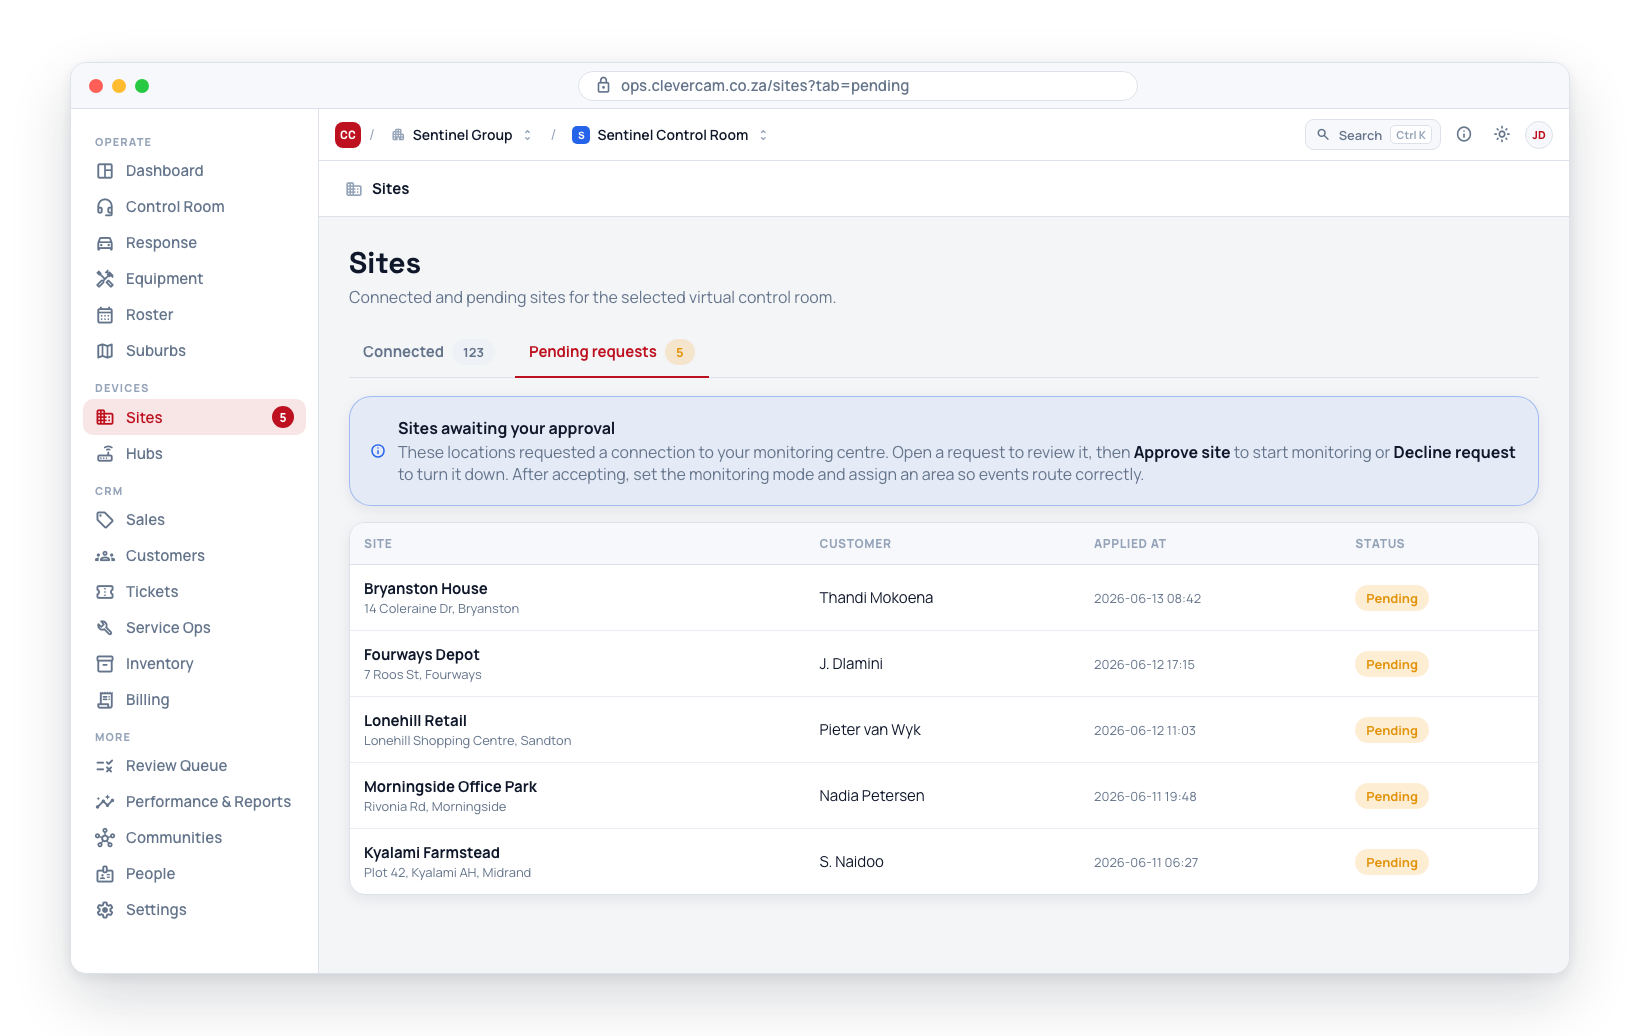
- Click Connected or Pending site counts to jump to the sites list filtered by that tab.
- Click the Hubs & Uptime card to go to the Hubs page.
- Flip the Public Visibility toggle to make the control room public or hide it (a confirmation dialog appears first).
- Click the Control Room count to open the Control Room page, Responders to open Response → Responders, or Technicians to open People.
Dropdowns anywhere in CleverOps
Every dropdown in CleverOps is drawn by the app itself, so it looks and behaves the same on Windows, Mac and in any browser.
- Click the field, or focus it and press ↓ / ↑, to open the list.
- Arrow keys move through the options, Enter picks one, Esc closes without changing anything.
- Start typing to jump to the first option beginning with those letters.
- Once a list runs past a dozen options it opens with a search field at the top — type to narrow it. Very long lists show the first 200 matches with a line saying how many more there are, so keep typing to find the rest.
- Options shown in grey are listed but cannot be picked; hover for the reason where one is given.
The dashboard is designed to give you the most important information at a glance. Use the sidebar to navigate to specific sections when you need to take action or drill into details.