Active Events Map
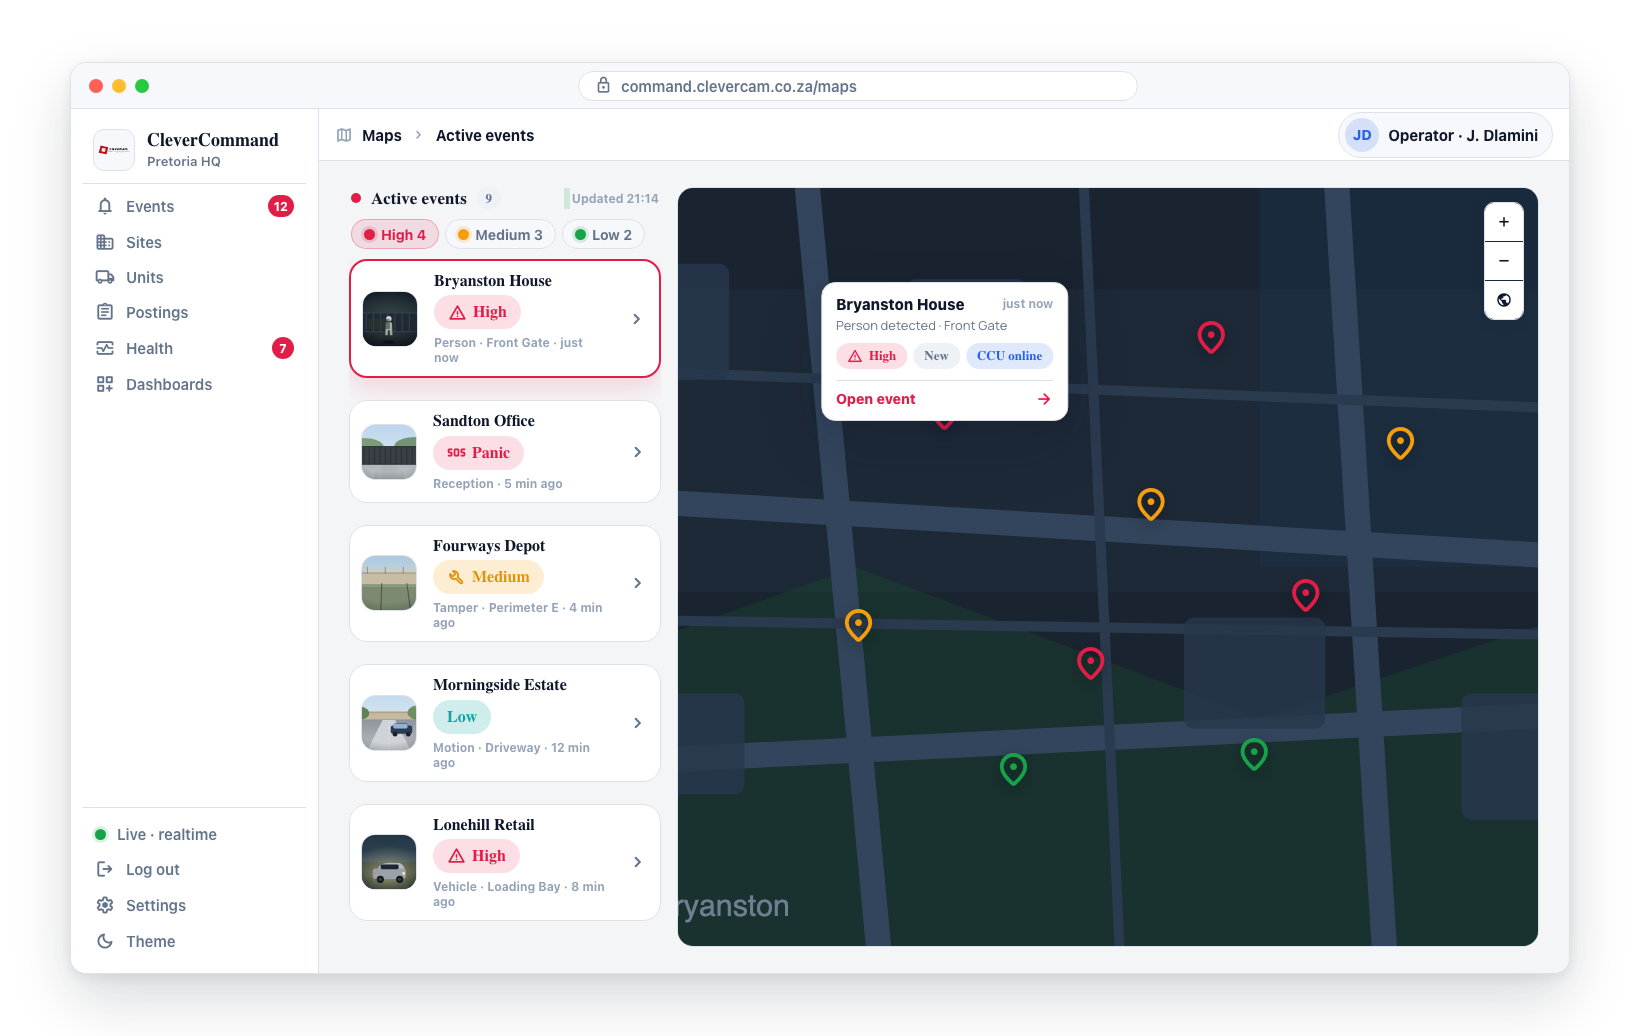
The Active Events Map provides a geographic view of all currently active security incidents across your monitored sites. Each event is represented by a color-coded marker on the map, giving operators spatial awareness of where incidents are occurring and how they are distributed across the coverage area.
Accessing the Active Events Map
- Open the supervisor toolbox at /more — it has no sidebar entry, so browse to the address directly — then open the Maps tab
- Select the Active Events view (this is typically the default map view)
- The map loads with markers for all currently active events
Maps lives on the supervisor toolbox page at /more. There is no sidebar entry for it — supervisors browse to the address. The page checks the Supervisor role and the Advanced Alarm Handling module before it renders, so if it turns you away, one of those is missing. See Optional Surfaces.
Map Markers
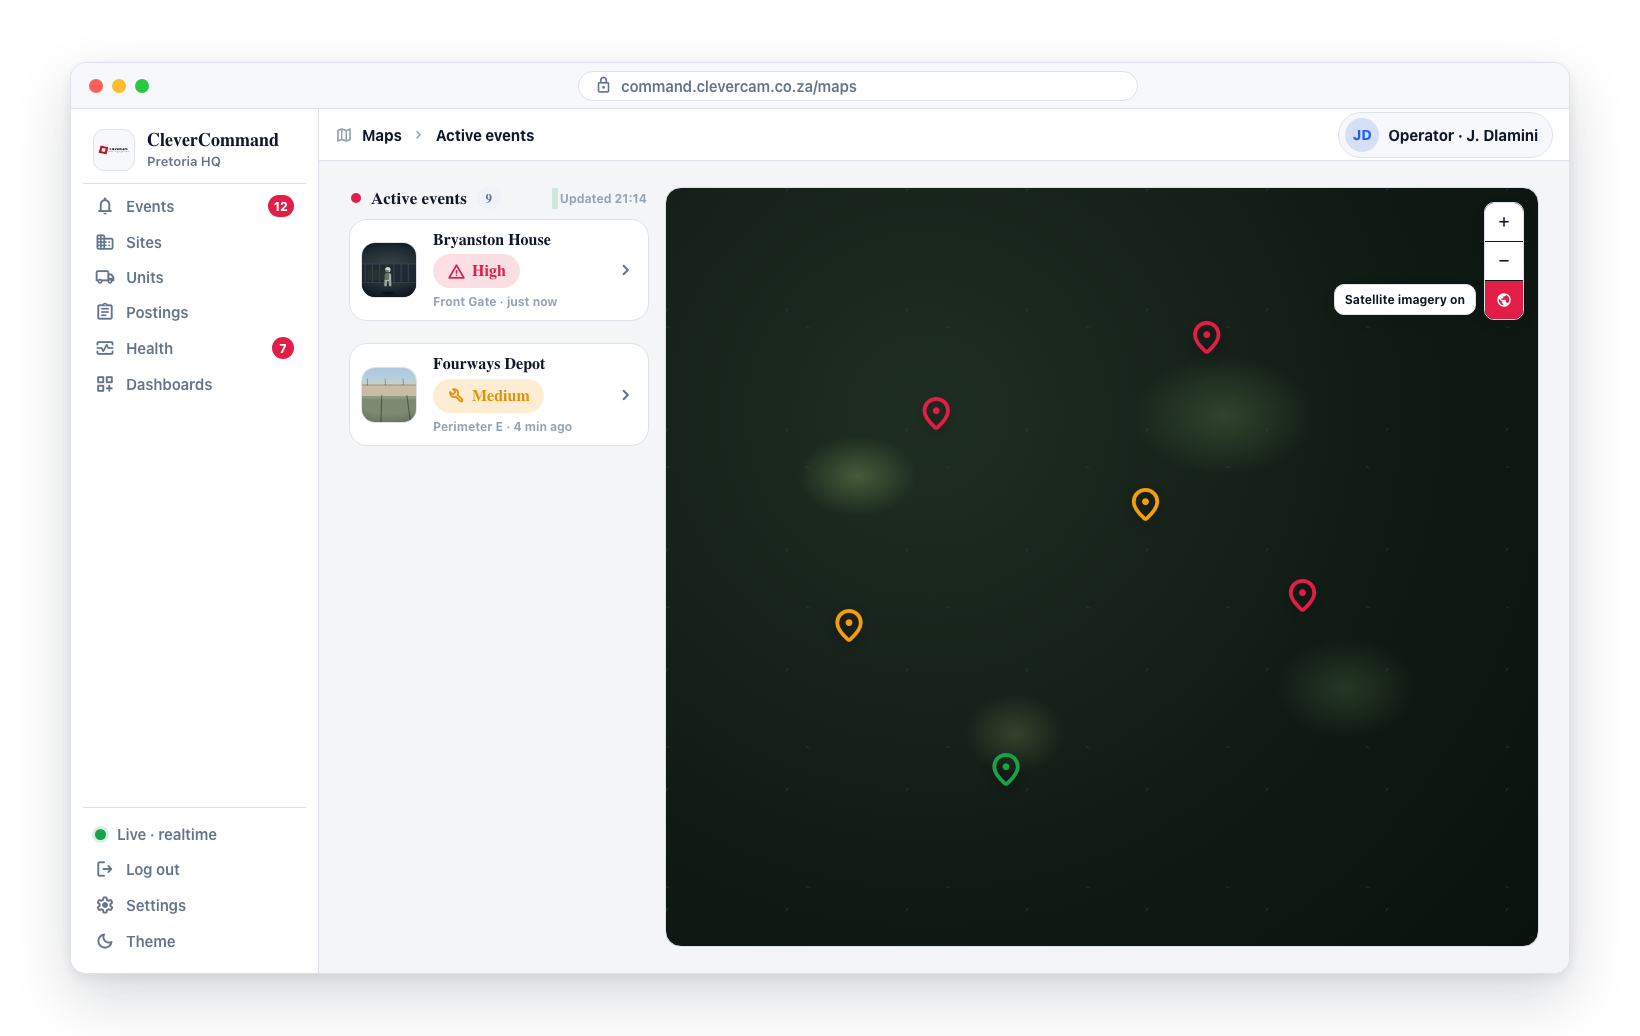
Each active event is represented by a marker on the map. Markers are color-coded by severity level:
| Color | Severity | Description |
|---|---|---|
| Red | High | Critical events requiring immediate attention |
| Orange | Medium | Events that should be reviewed promptly |
| Green | Low | Lower-priority events for routine review |
A mobile panic plots at the sender's live GPS position rather than a site address, and its popup and list entry are labelled 📍 Mobile Panic instead of a site name.
Marker Limit
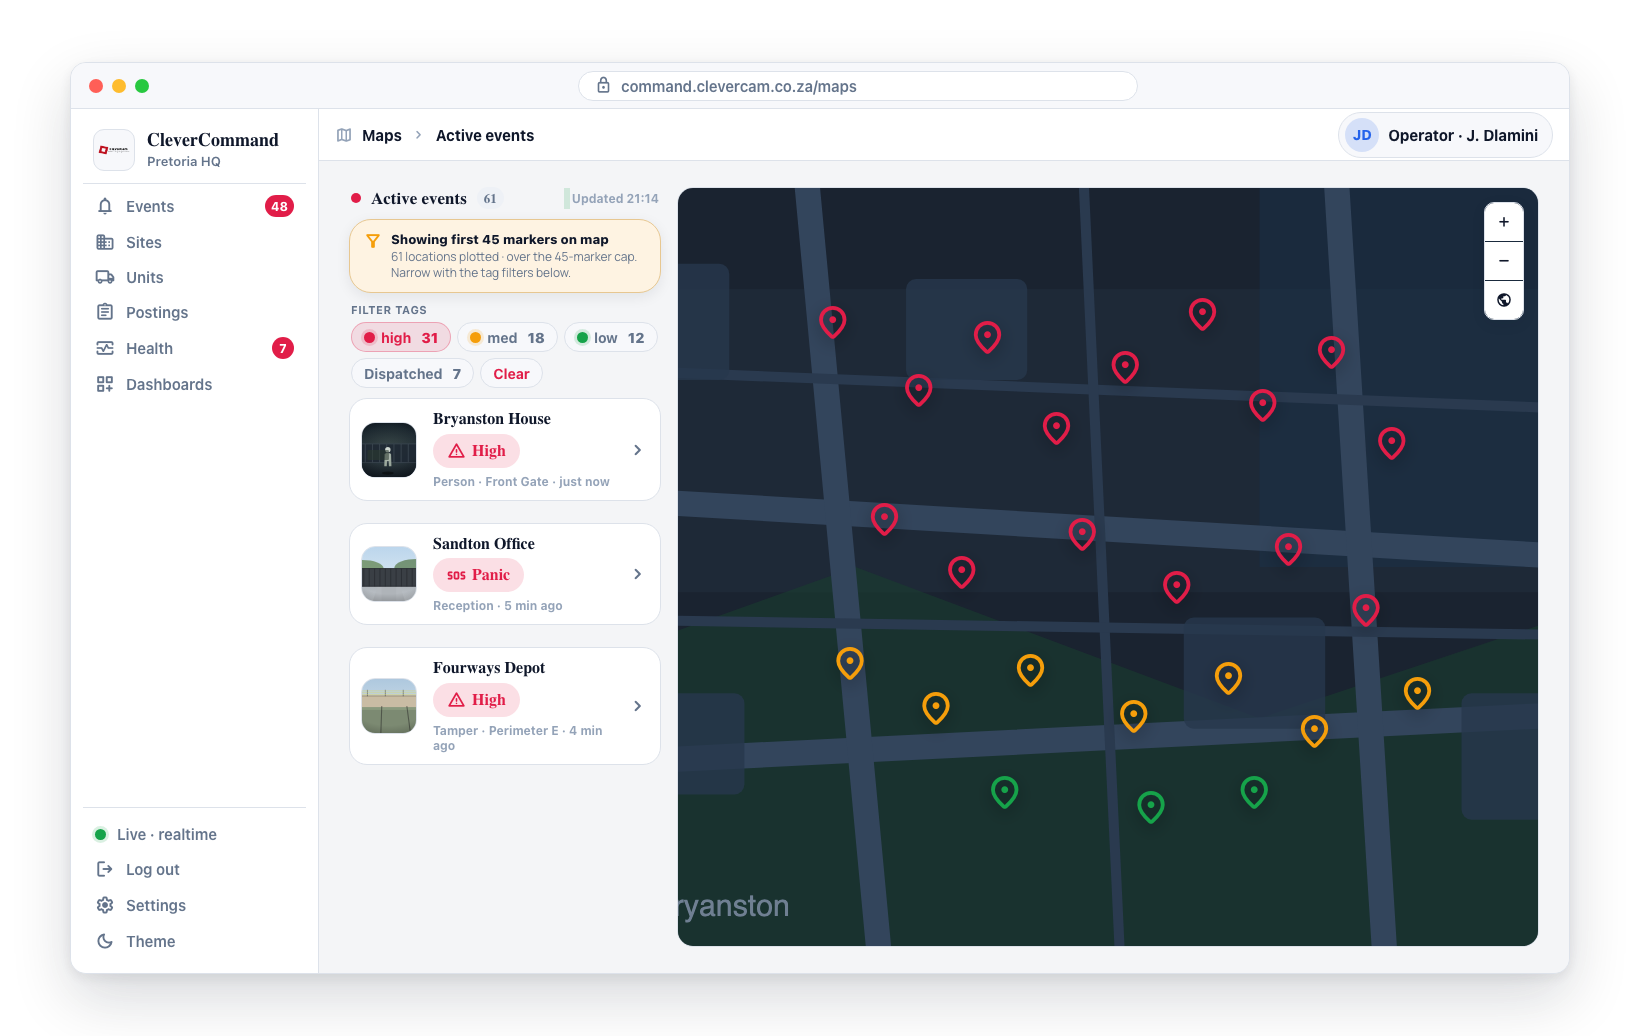
The map renders up to 45 markers at a time. When the current view has more items than that, the first 45 (in list order) are plotted — there is no clustering. Use the tag filters to narrow the set when you are over the limit.
Live Refresh
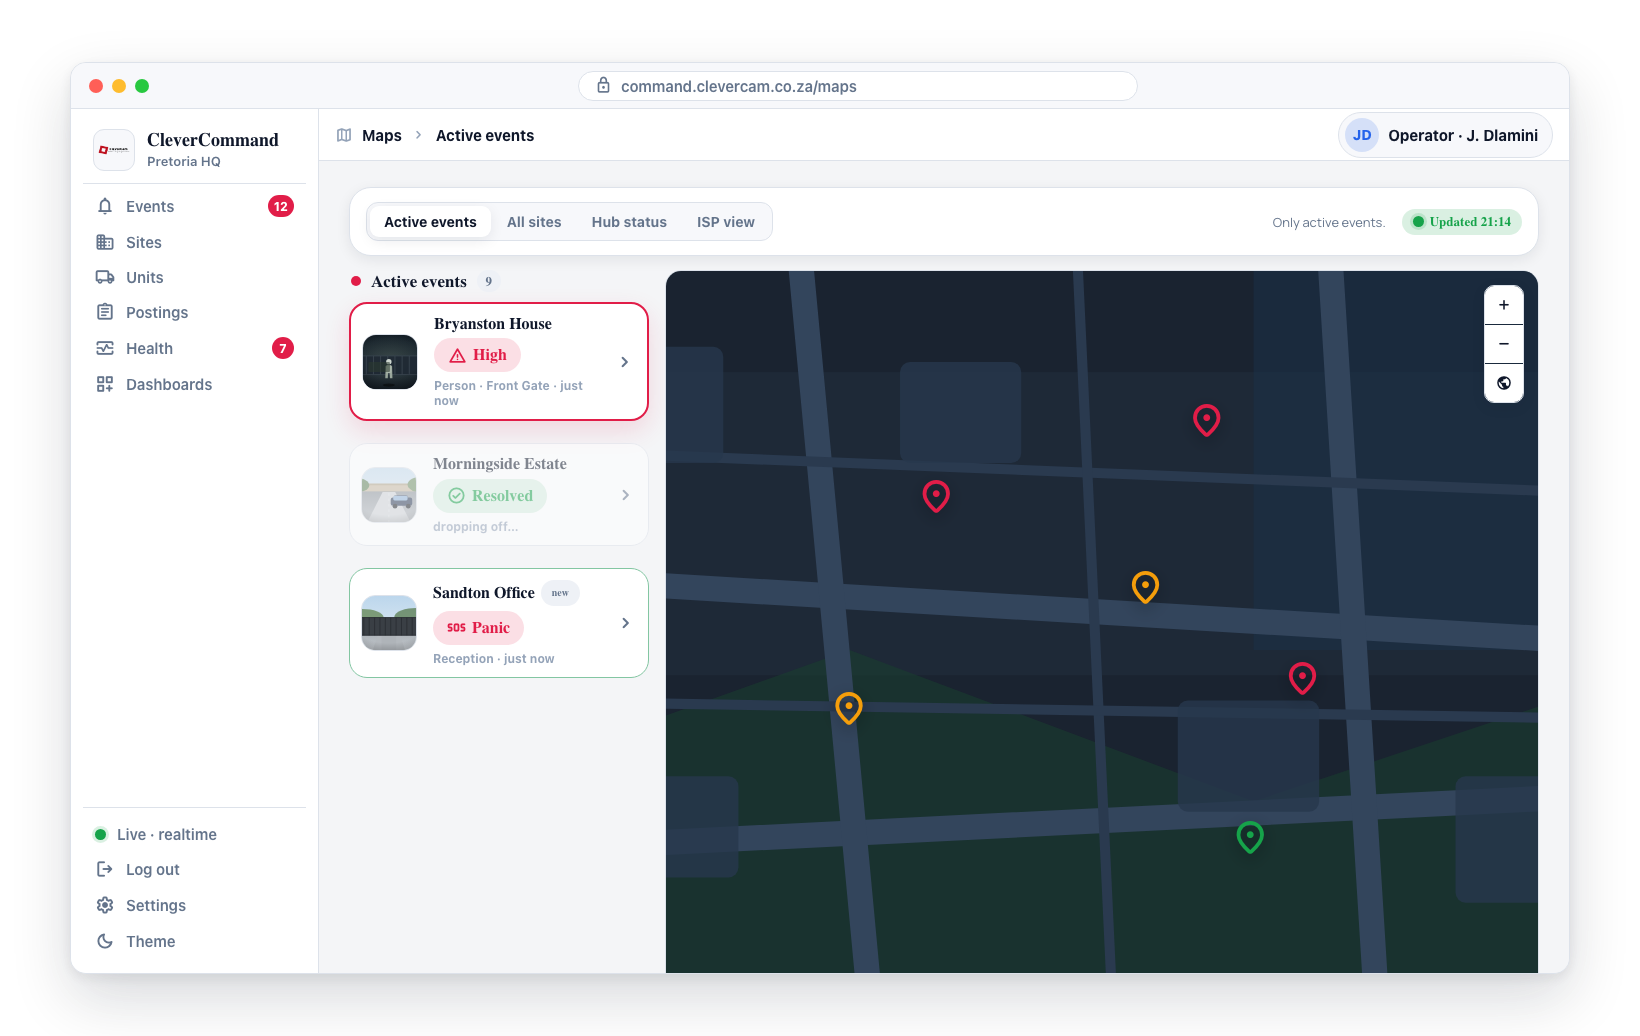
The map is live, not a snapshot: it reloads automatically when events, dispatches, or hub statuses change (throttled to at most once every 2 seconds), plus a 60-second fallback poll. An "Updated HH:MM" stamp in the map toolbar shows when data last landed, so freshness is verifiable at a glance — resolved events drop off the map without a page refresh.
Interacting with Markers
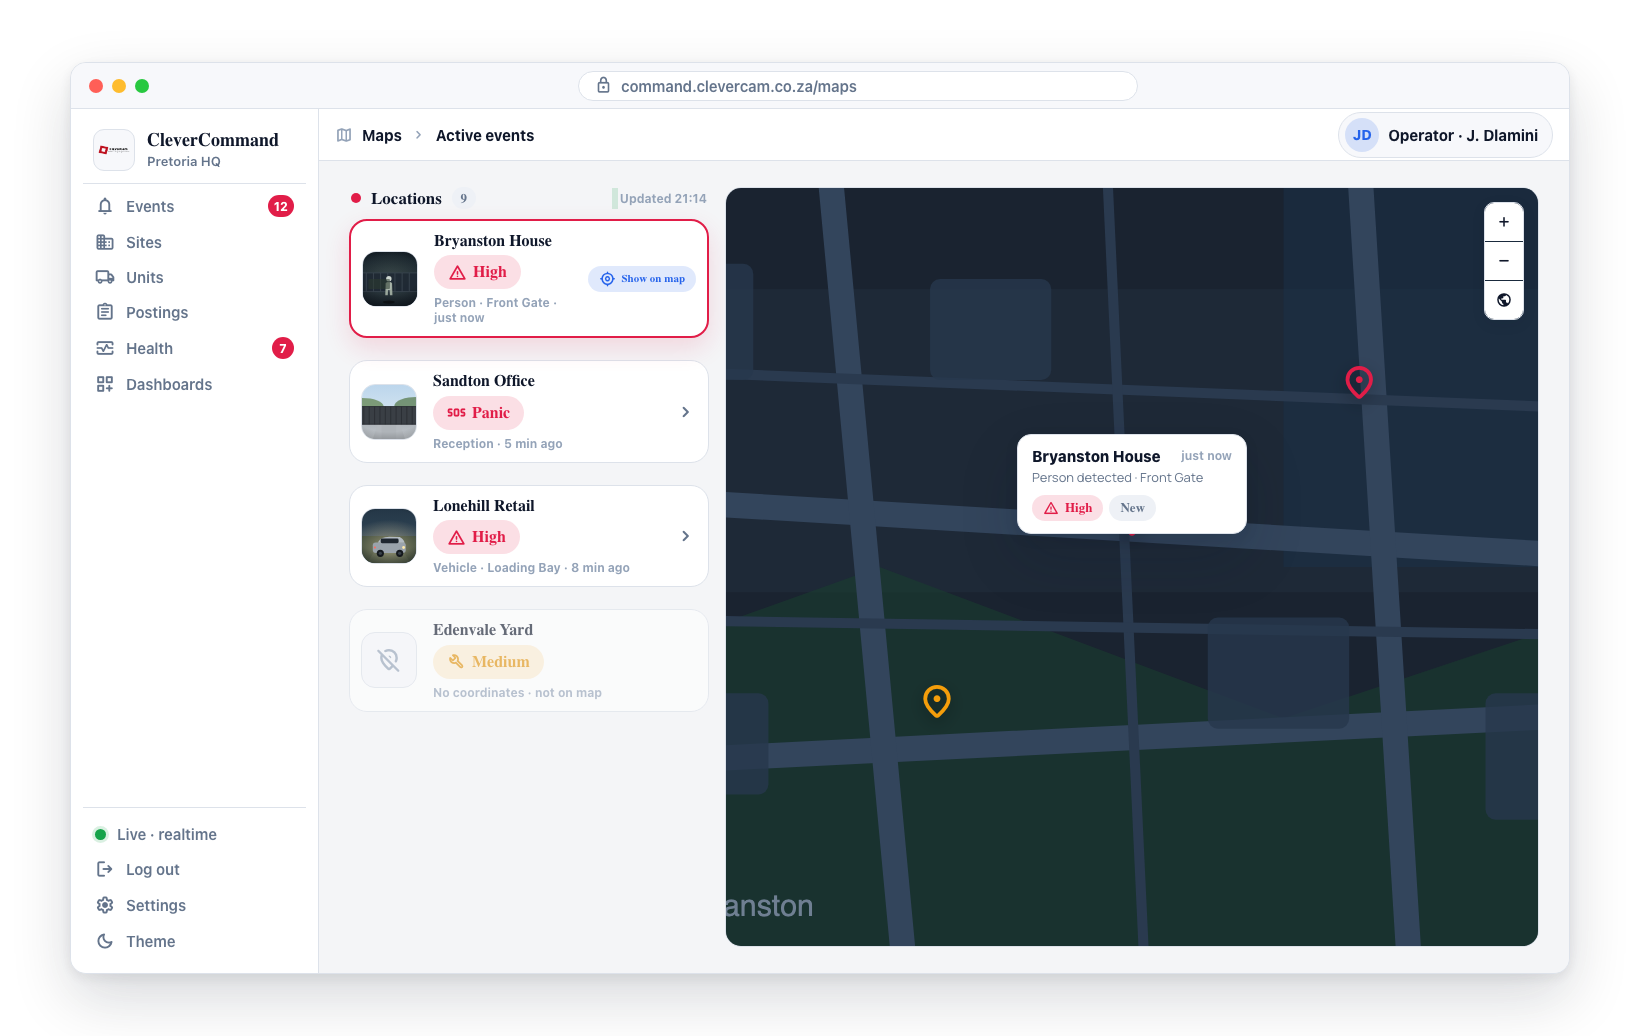
Click on any event marker to see a popup with key event details:
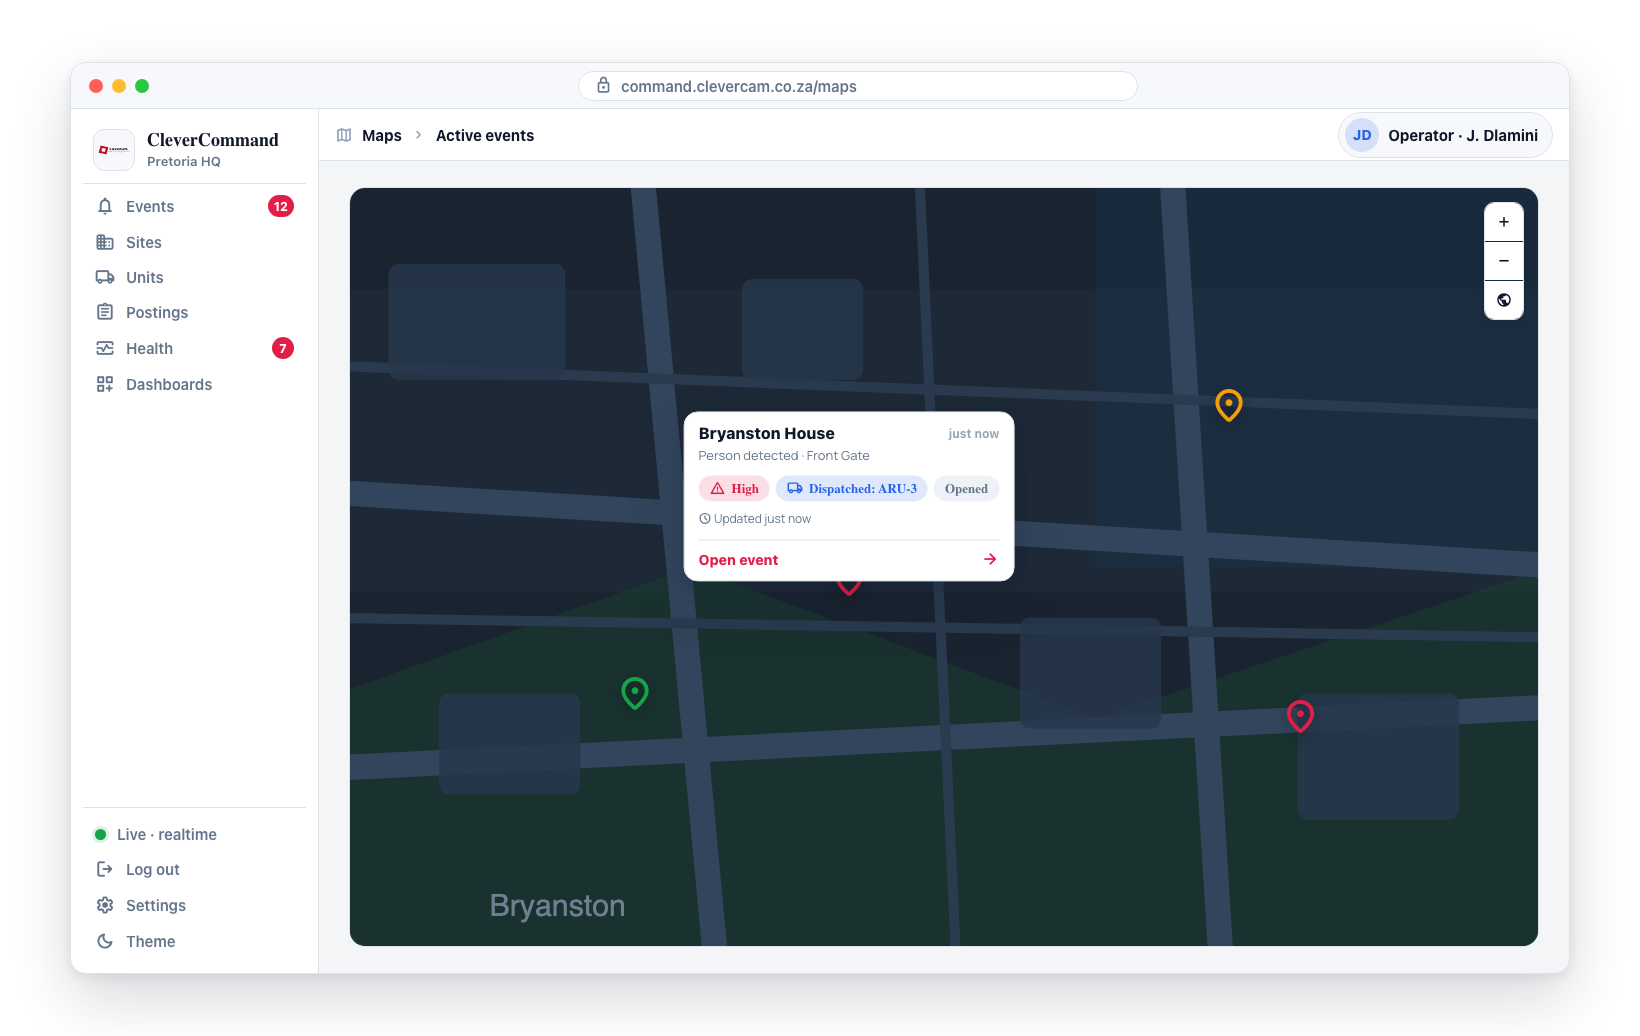
- Site name
- Event title and status tags
- Time since the last update
On the Active events view, the popup includes an Open event → button that jumps straight to that event's details page.
Locations List
The list panel beside the map mirrors the plotted items. Clicking a card flies the map to that marker and opens its popup — useful for matching a list entry to its location without hunting visually. Cards without coordinates are not clickable.
Map Navigation
- Pan -- Click and drag to move around the map
- Zoom -- Use the scroll wheel or pinch gesture to zoom in and out
- Zoom controls -- Use the + and - buttons on the map for precise zoom adjustments
- Satellite view -- Click the globe button below the zoom controls to switch the base map between the default street view and satellite imagery. The toggle is per-session and defaults to street view on every page load.
Using the Active Events Map
The Active Events Map is most useful for:
- Spatial awareness -- See at a glance which geographic areas have active incidents
- Pattern identification -- Multiple events in one area may indicate a coordinated incident or a common trigger (such as weather affecting multiple sites)
- Dispatch planning -- Identify which response units are closest to an active event (combine with the Units Map)
- Shift briefings -- Give incoming operators a visual overview of current activity
Use the Active Events Map at the start of your shift to get geographic context for the current event queue. It is much faster to understand the distribution of incidents on a map than scrolling through a list-based queue.