Event Queue
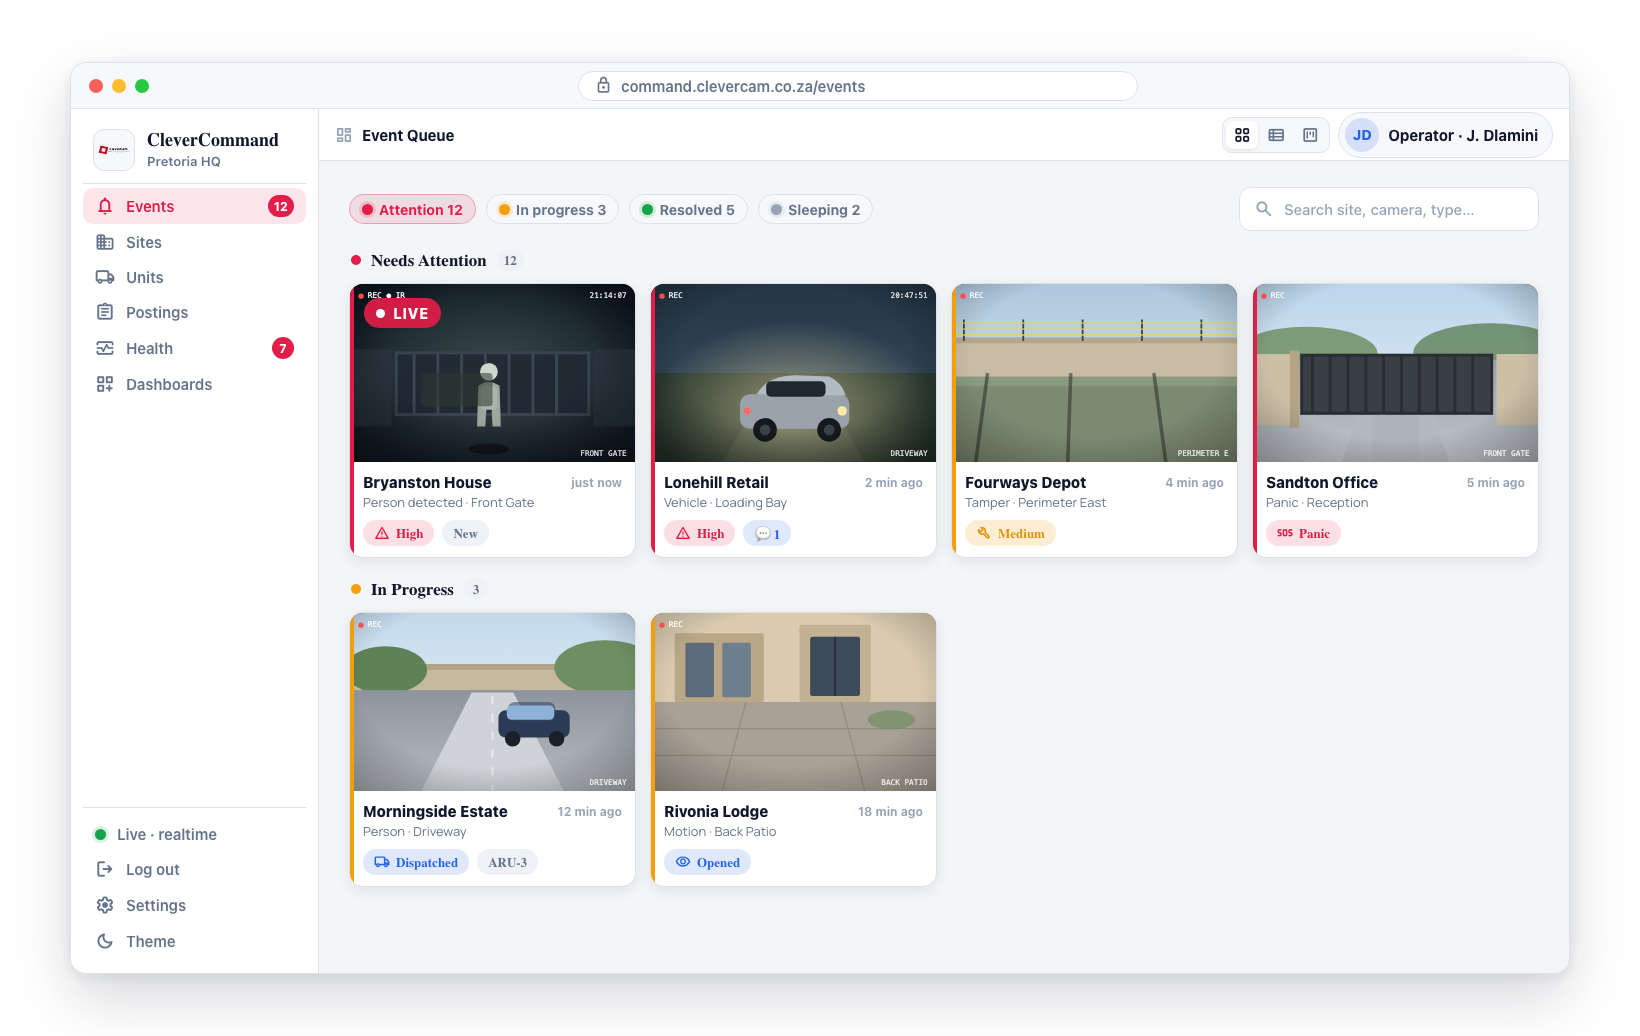
The Events page is the primary command center view in CleverCommand. It displays a live queue of security events assigned to your control room, updated in real time as cameras across all monitored sites detect activity. This is where operators spend most of their time -- triaging incoming events, opening details, and taking action.
How the Queue Works
Events appear in your queue the instant a camera generates a detection. The queue updates automatically without needing to refresh the page. When a new event arrives, it appears at the top of the queue (or in its sorted position) and any configured alerts (sound, flash, notification) are triggered.
The queue only shows events that are assigned to your control room and are currently active (not yet closed). As events are closed by you or other operators, they disappear from the queue.
Queue Layout
The event queue displays the following information for each event:
| Field | Description |
|---|---|
| Severity | Color-coded indicator: red (high), orange (medium), teal (low) |
| Site name | The site's name — one name per site, set by your control room (CleverOps → site details → Site name). The street address renders as a muted line directly below it. For a shared panel split into separate premises, the premises name leads instead (see Partitioned premises) |
| Event type | The type of detection (alarm, intrusion, motion, etc.) |
| Camera | The camera that generated the event |
| Time | When the signal was received (14:32). The board stays scannable at a glance — hover for the full stamp with the date and seconds, or open the event, where Time received shows the second |
| Thumbnail | A snapshot image from the camera at detection time (in cards view) |
Holiday notes & site heads-up notices
When a site has an active notice targeting the control room, it is surfaced on the event before you work the alarm. Typical messages are short-lived, site-specific heads-ups such as "On holiday — phone Jaco at 072 219 5375" or "Keyholder away until Monday".
A notice is one of two kinds, and the emoji tells you which at a glance:
| Badge | Kind | What it means |
|---|---|---|
| 🏖️ | Holiday / away | Nobody is at the property — the client is away and the keyholder is likely unreachable |
| 📌 | General notice | Any other short-lived heads-up (renovations, phones down, guard on site) |
Where it shows
- Cards and kanban view — an amber banner at the very top of the site's event card, above the time, chips and address. A holiday note is prefixed On holiday — and carries the notice's active date range (e.g. · 14 Jul – 21 Jul). If a site has more than one active notice, each renders as its own banner strip, stacked top to bottom.
- Table view — a compact amber 🏖️ On holiday (or 📌 Notice) chip in the row's chip strip, since a row has no room for a banner. When a site has several notices the chip shows a +N suffix, and hovering it lists them all.
- Event details — the same banner in the notes section, alongside the Action Plan instructions and site notes. See Actions & verification.
Click for more info
Clicking the banner or the chip opens the Holiday notes & notices popup for that site. It shows:
- the full text of every notice running now or scheduled to start, each with its dates and status; and
- a Past notices section listing the site's expired notices, dimmed and marked Ended.
Past notices are kept on purpose — they answer "when was this site last away?" long after the dates have passed. They are history only: an expired notice never appears on a card, in a row, or in the customer's app.
The popup is read-only. Notices are authored in CleverOps under Site → Monitoring → Scheduling → Holiday notes & temporary notices, or by the customer from their app under More → Help & service → I'm away.
When a notice shows
A notice reaches the queue only while today falls inside its from–to window and its audience includes the VCR team member (control-room) role. When the window passes the banner and chip disappear automatically. See the CleverOps Temporary notices documentation for how they are created.
Site on test & other suppressed states
A site that a technician is currently testing fires real alarms on purpose. Since these must never be dispatched to, the queue flags them before you start working the alarm — rather than letting you call the keyholder and only then discover the dispatch is refused.
The flag appears whenever the site is in one of the four states that suppress dispatch:
| Badge | State | What it means |
|---|---|---|
| 🧪 | On test | A technician is testing the alarm system. Time-boxed (60 minutes by default) and clears itself. |
| 🔧 | Maintenance | The site is under maintenance. |
| ⛔ | Suspended | Monitoring is suspended for this site. |
| 🏗 | Installation | The site is inside its installation window, set from CleverOps. |
Where it shows
- Cards and kanban view — a violet, diagonally hatched banner at the very top of every event card for that site, above the holiday/notice banners. It reads e.g. 🧪 On test · dispatch suppressed · until 12:18, plus the reason if one was captured.
- Table view — a compact violet 🧪 On test chip in the row's chip strip. Hovering it gives the full sentence, including when the state ends.
- Event details — the same violet banner at the top of the notes section, above the holiday notes.
The hatched violet styling is deliberately different from the amber of a holiday note and from every event-state chip, so you can tell at a glance that the site is in a state, not that the event is.
What it does and doesn't do
- The events keep arriving and are recorded normally — the flag never hides or filters anything.
- Dispatch to that site is refused while the state holds. The refusal is enforced on the server, so the flag is a heads-up, not the control.
- The flag disappears on its own when the window expires. The queue re-checks about once a minute, so a state started or cleared mid-shift shows up without a refresh.
To put a site on test, or to clear one early for a genuine emergency, see Site Test Mode.
Mobile Panic events
A card or row with no site name is not missing data -- it's a mobile panic sent from the CleverAlert app's Location Panic feature. These show a red 📍 Mobile Panic badge with the sender's name in place of the usual site name, and the event details page shows the sender's identity and live position instead of a site card. See Mobile Panic Events for the full picture, including dispatching to the sender's moving position.
Partitioned premises
When one alarm panel serves several households and the site has been split into separate premises in CleverOps, an event from one of those partitions is headlined by the premises name (e.g. Cottage 3) instead of the site address. In Cards view the site address moves down into the card's meta line; in Table view it follows the premises name as muted text. Searching by the premises name finds only that household's events. Panel-wide signals (power, battery, comms, tamper, test) and ordinary sites are unchanged. See Partitioned Premises for how the event workspace, dispatch and call list behave.
Queue Status Sections
Events in the queue are organized into four status sections, not simply sorted by time. Each section groups events by their current stage:
| Section | Description |
|---|---|
| Needs Attention | New events that have not been opened, dispatched, or acted upon. These are your priority. |
| In Progress | Events that have been opened, dispatched, or where a unit has arrived on scene. |
| Resolved | Events marked as All in Order, Problem at Site, or closed by the operator. |
| Sleeping | Events that have been put to sleep and will reappear when the sleep timer expires. This section is collapsed by default. |
Each section header shows the event count for that section. You can click a section header to collapse or expand it.
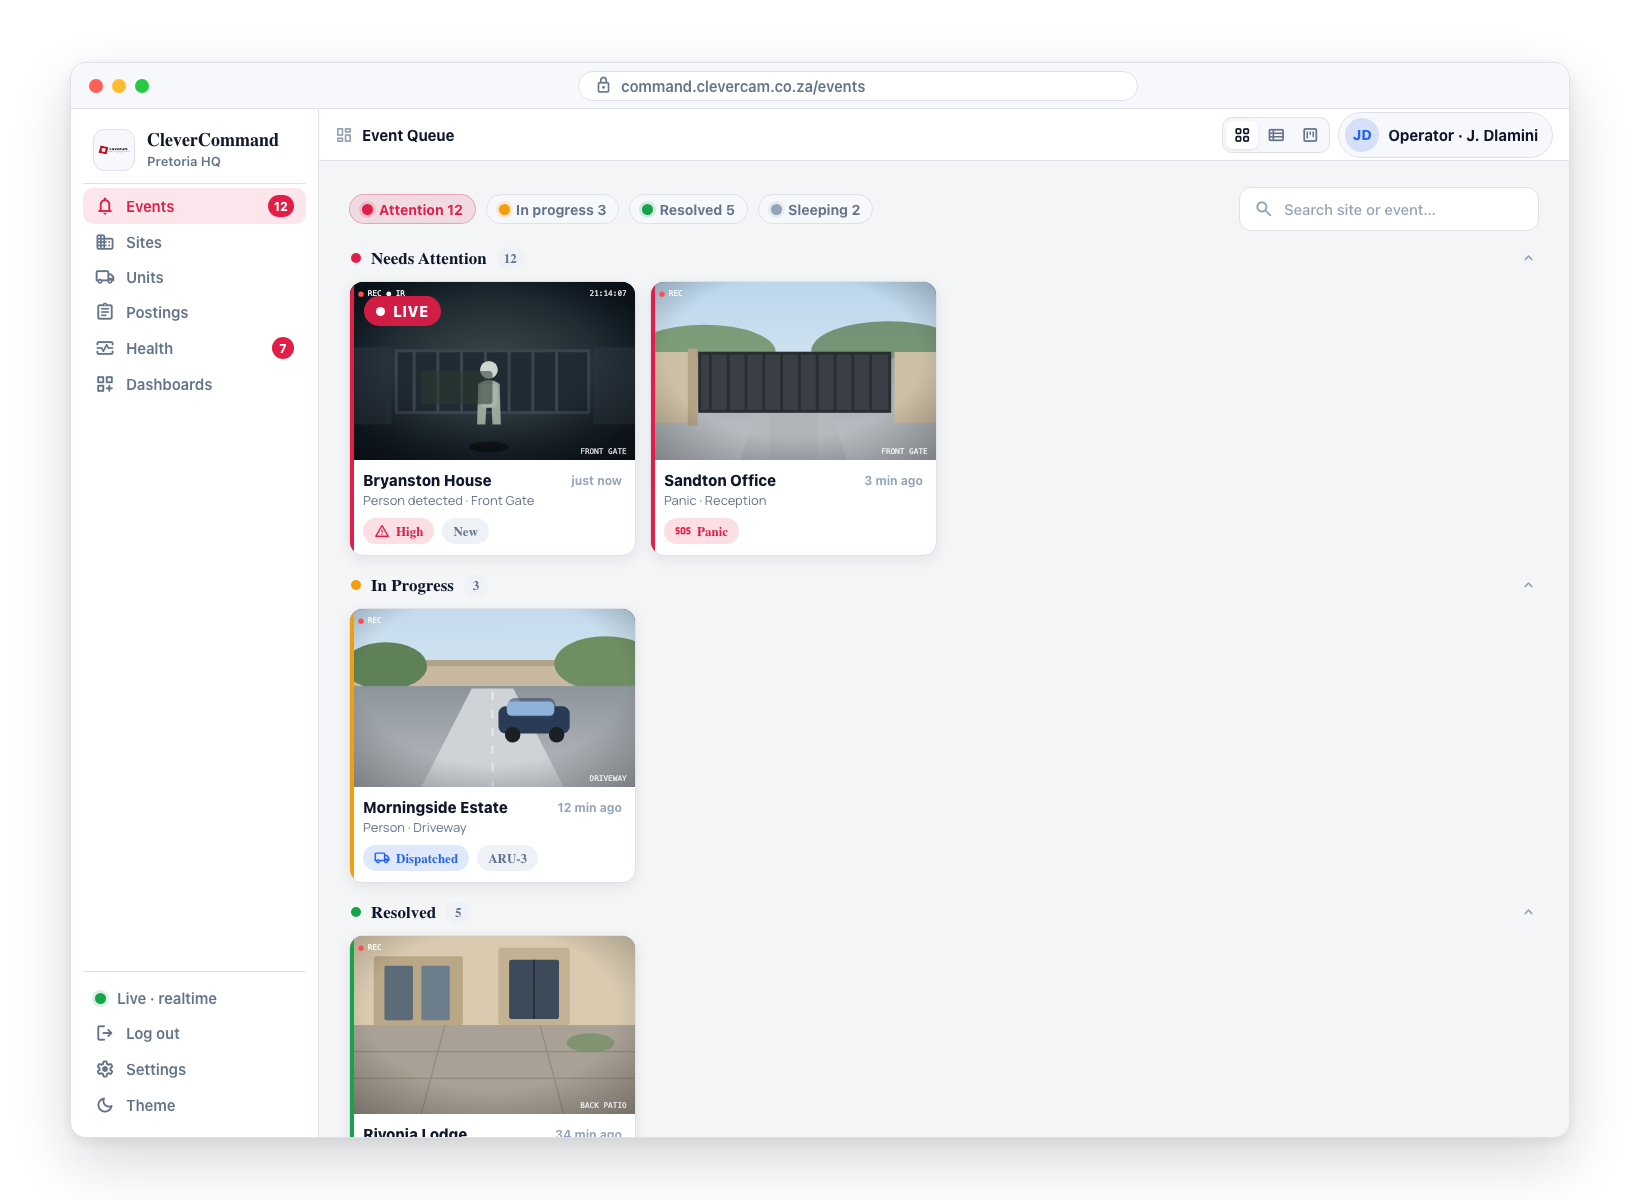
At the top of the queue, filter chips show the count for each section. In Cards and Table view, clicking a chip scrolls the queue to that section. In Clever/Advance Mode, clicking a chip toggles focused-column mode — that column expands and the others collapse to thin vertical strips. Click again to return to the balanced kanban layout.
Viewing Events
- Open the Events page from the sidebar (this is also the default home page)
- The queue loads automatically with all active events for your control room
- Events are grouped into status sections (Needs Attention, In Progress, Resolved, Sleeping)
- Click any event in the queue to open its full details page
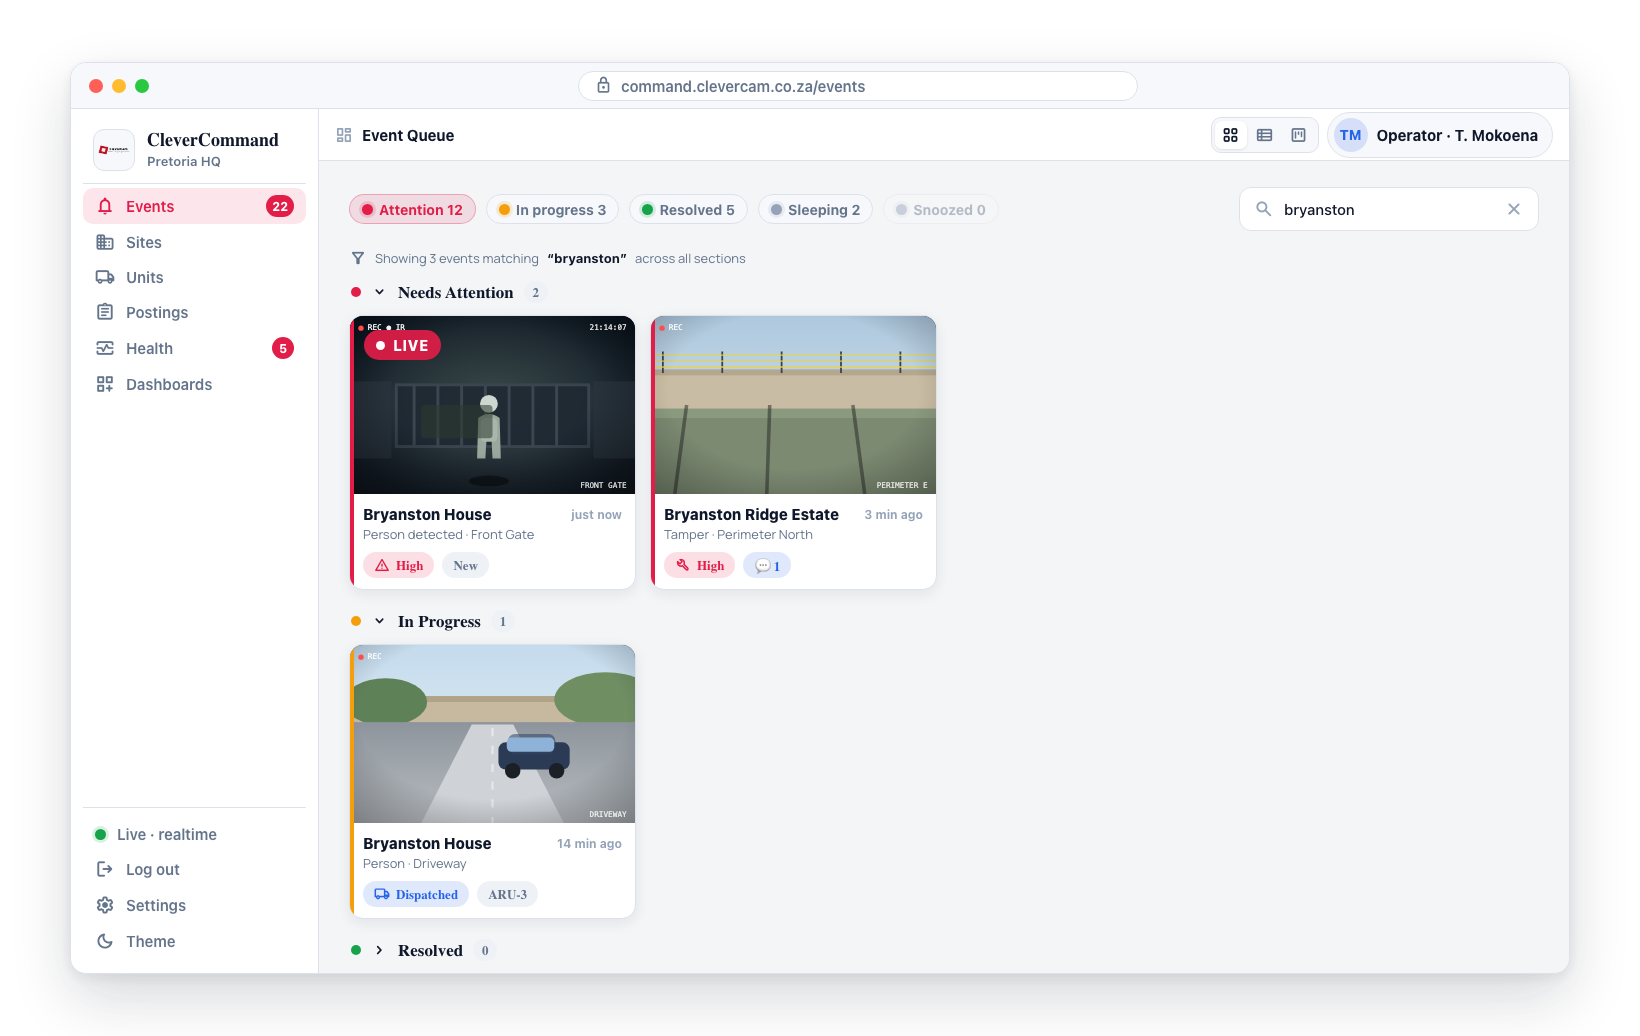
- Use the search bar at the top to filter events by site name (operational or app name), street address, company reference, event type, or title
Queue Section Counts
At the top of the queue, section counts show how events are distributed. These counts give you a quick overview of the queue composition without needing to scroll through every event. The counts update in real time as events come in and are closed.
Response SLA and the OVERDUE counter
When your control room has configured response-SLA timers (set per event type in CleverOps — see the Review Queue's Response SLAs tab for VCR defaults, or per site in the Site SOP panel), the queue tracks how long each unactioned event has been waiting against its target.
Per-card SLA badge. Every event still awaiting first response (i.e. in Needs Attention / Verification — not yet opened, dispatched, sleeping, or resolved) shows a small SLA badge that escalates with elapsed time:
| Badge | Meaning |
|---|---|
| ⏱ SLA (grey) | Within the response target. |
| ⏰ Follow up (amber) | Past the reminder time — nudge to follow up before the target breaches. |
| ⏱ Overdue (red) | Past the response target — counts toward the OVERDUE total. |
| ⚡ Dispatch due (red) | Past the auto-dispatch timeout — dispatch is the recommended next step. Click the normal dispatch action (dispatch consent still applies). |
The badge's response target reflects the event's pattern type (e.g. a panic alarm has a much tighter target than a comms-fault), the site/VCR configuration, and whether the event arrived during the day or night shift.
Panel low battery (E302, E309, E311) and communication trouble (E350) signals have had their own SLA clock since 1 September 2026 — low battery as its own Low battery pattern and E350 under Hub / device offline, both with the same 15-minute default target as an AC-mains failure. Before that they resolved to no pattern and could never show Overdue.
Automatic escalation (Clava Mode). On Clava-Mode control rooms, a background check (runs ~every minute) also turns these thresholds into proposal chips on the card, using the exact same timers as the badge:
- When the reminder window passes and the event is still unactioned, it adds a call-keyholder proposal (operator nudge).
- When the auto-dispatch window passes and the site has auto-dispatch consent, it pre-selects a recommended dispatch chip — the operator still clicks to dispatch, and the normal dispatch-consent gate applies.
It never doubles up on a step the Brain already proposed, and it respects sleep exactly like the badge (a parked event is skipped; a woken one restarts its clock).
OVERDUE counter (header). When SLA timers are configured, a ⏱ OVERDUE indicator appears in the queue header showing how many events are past their response target. Click it to filter the queue to only overdue events across every stage; click again to clear. The filter auto-clears when nothing is overdue.
Putting an event to sleep is deliberate automation — power-fail and area-power-fail self-heal waits, post-arm walkthrough grace, late-to-close waits, and similar scenarios the system expects to auto-resolve. Time spent sleeping does not count toward the response SLA:
- While an event is sleeping, it shows no SLA badge and is excluded from the OVERDUE count.
- If an event wakes without auto-resolving, its response clock restarts from the wake moment — it gets a fresh response window, and the badge tooltip notes "timing from wake (sleep not counted)".
- An event auto-resolved during sleep simply leaves the queue — it never breaches.
So the SLA measures how long an event is actively awaiting an operator — not how long the system intelligently parked it. The same applies to events re-opened by a new alarm image: the clock restarts at the re-open.
The SLA badges and the OVERDUE counter only appear once a response-SLA timer is configured for your control room. With no timers set, the queue behaves exactly as before. The elapsed-time check refreshes on the queue's ~60-second tick.
Auto-Updates
The queue is fully live. You do not need to refresh the page to see new events. CleverCommand ensures that:
- New events appear in the queue immediately
- Event status changes (claimed, closed, etc.) are reflected instantly
- If another operator closes an event, it disappears from your queue in real time
- If the connection drops and reconnects, the queue catches up with all missed events
If live updates drop
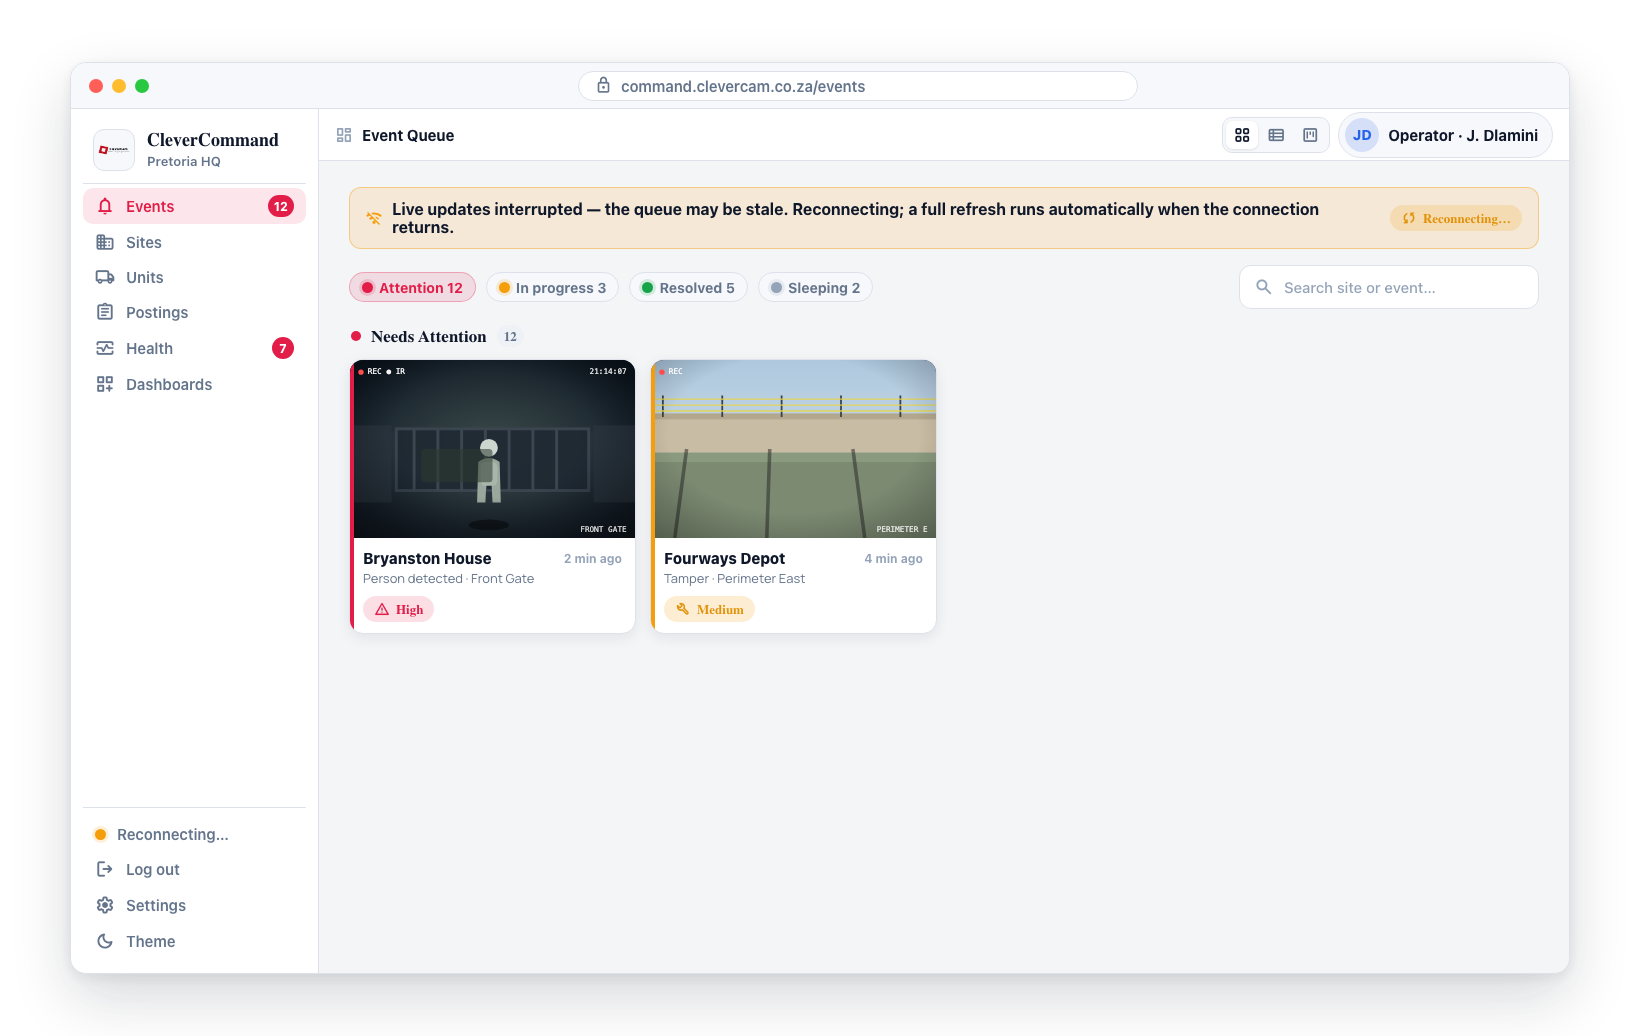
When the realtime connection degrades or disconnects, an amber banner appears directly above the queue — "Live updates interrupted — the queue may be stale. Reconnecting…" — in addition to the small connection pill in the sidebar. The queue refreshes automatically when the connection returns; the banner disappears once live.
If the queue fails to load
If the initial queue fetch fails (network blip at shift start), the queue shows "Couldn't load the event queue … Live updates will fill in automatically — or retry now" with an inline Retry button. Click Retry to re-fetch immediately; incoming realtime events also repopulate the queue as they arrive.
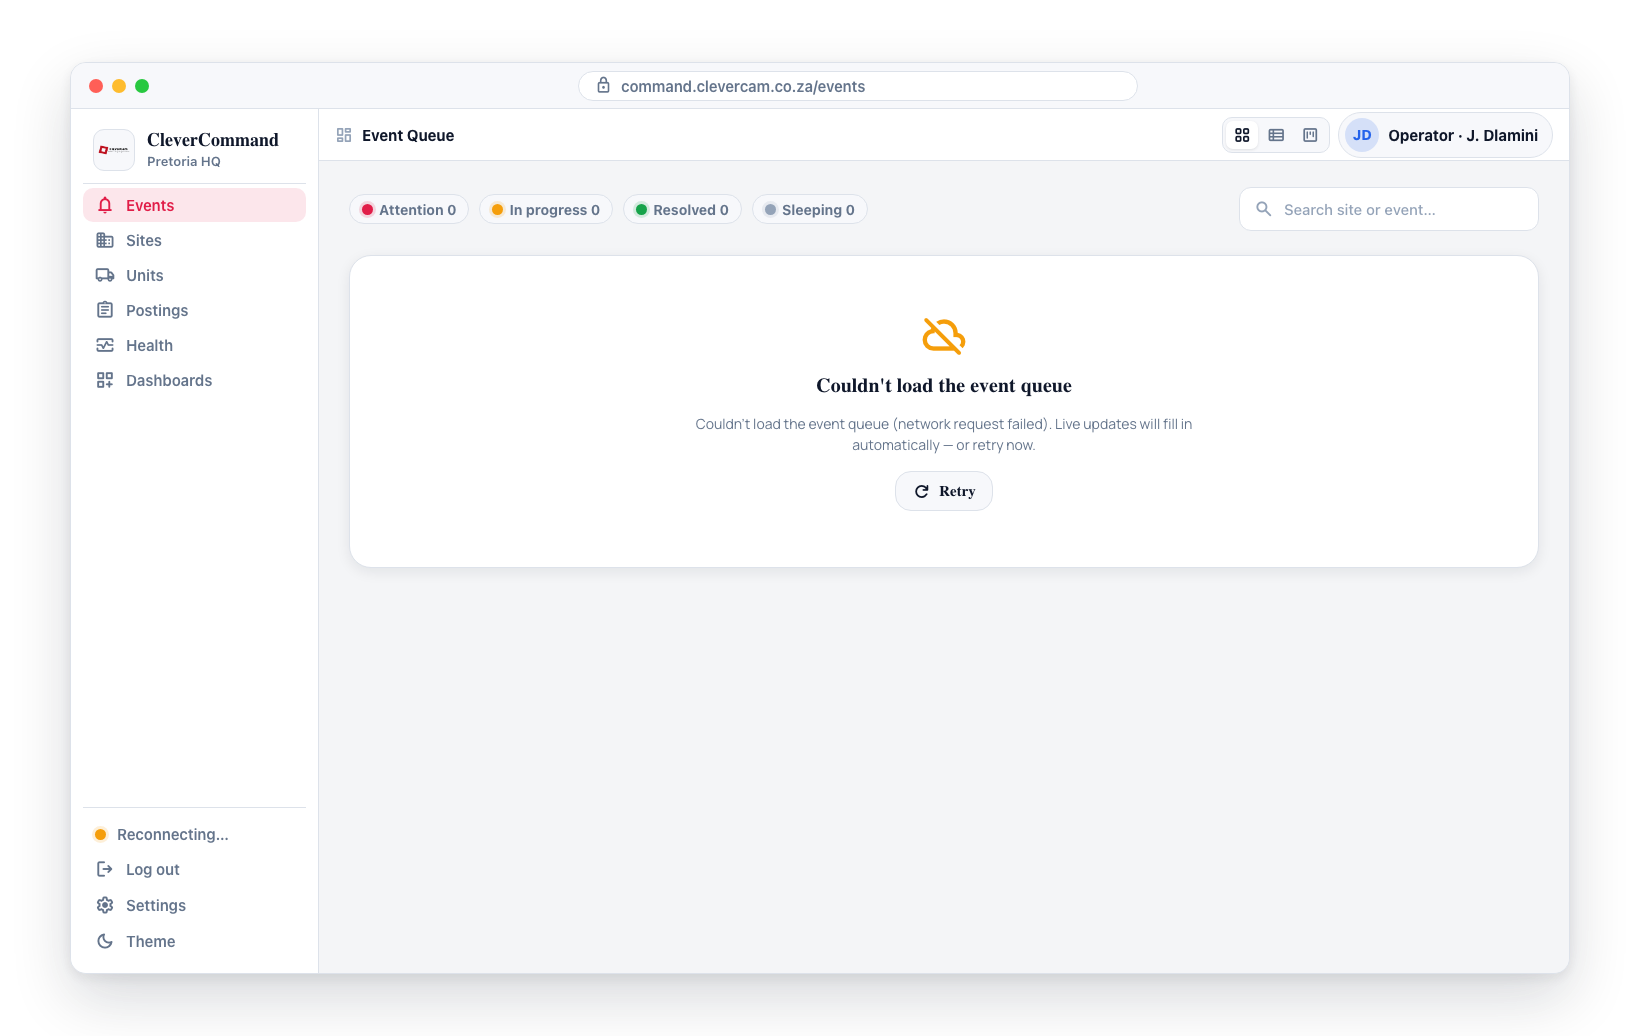
While the connection is down, actions that change an event -- completing it, dragging a card to Resolved or Sleeping, or accepting a Brain action -- are temporarily blocked, and a brief "Reconnecting…" message is shown instead. This prevents an event from looking resolved while the change never actually reached the server. The buttons become available again automatically as soon as the connection is restored.
Keep the Events page open as your primary workspace. The live queue combined with sound and visual alerts ensures you never miss an incoming event, even when you are focused on event details or other pages.
Empty Queue
When there are no active events in the queue, a clear indicator is shown. This means all events have been handled -- but stay alert, as new events can arrive at any moment.
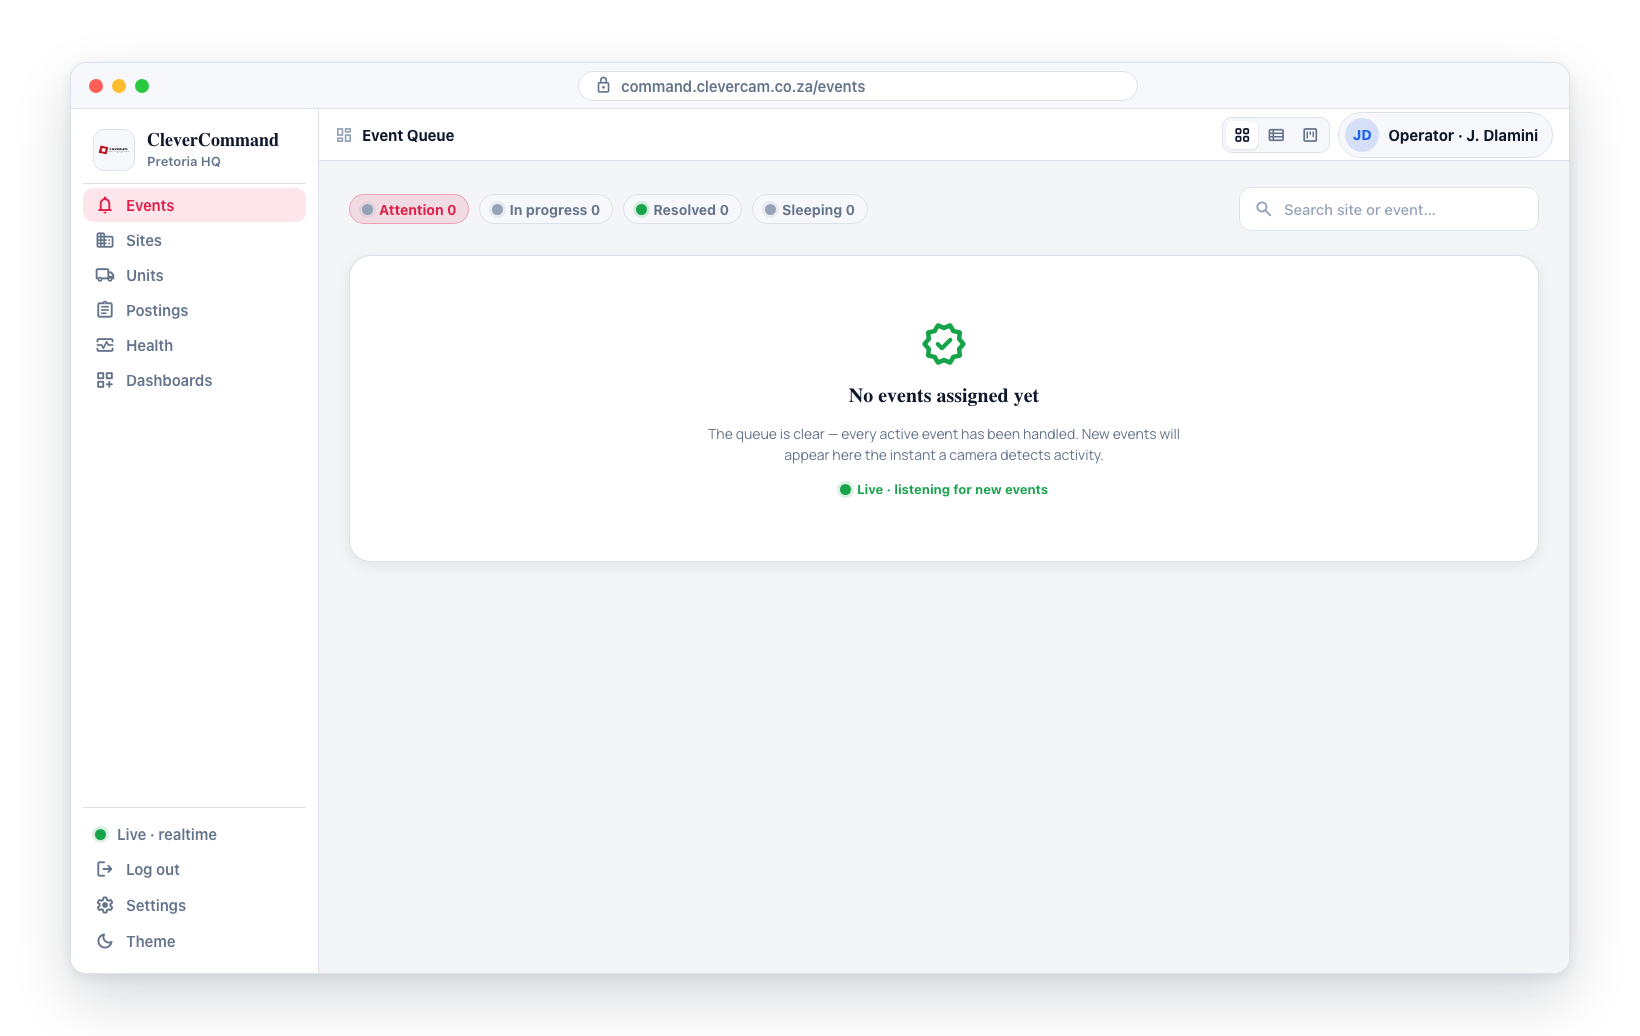
The event queue is shared across all operators connected to the same control room. Events claimed by one operator may still be visible to others until they are fully resolved, depending on your control room configuration.
Community Chimes and Guard Tours Panel
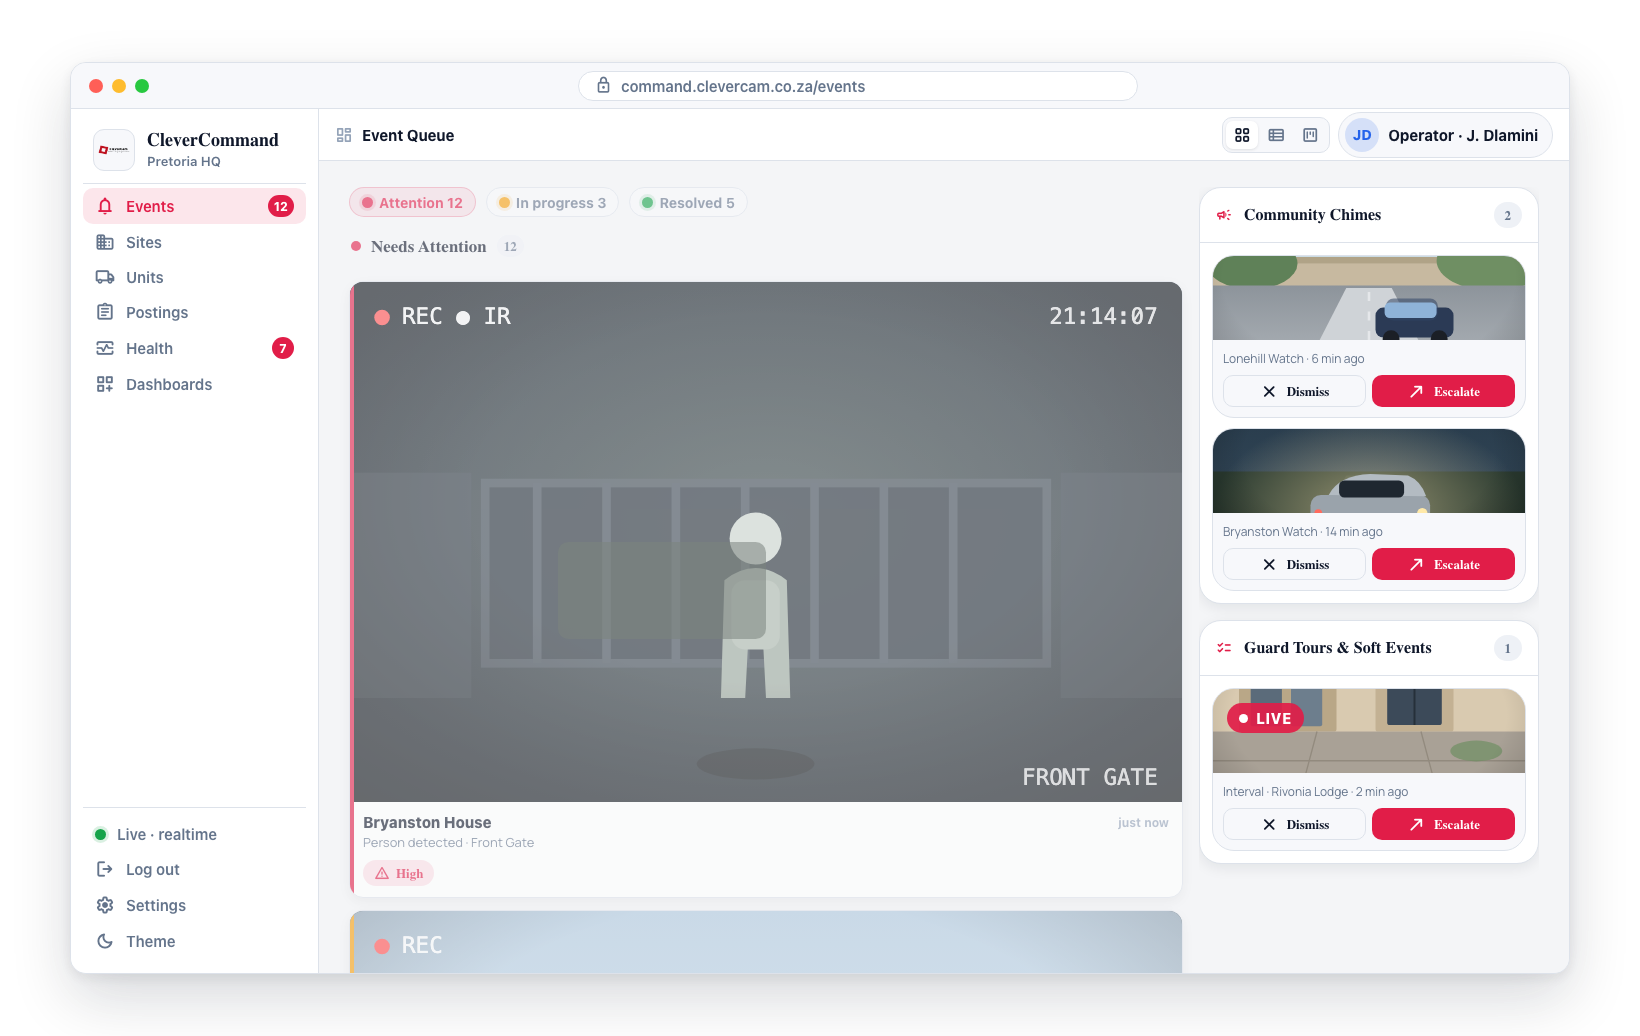
The Events page includes a panel for community chimes and guard tours alongside the main event queue. These are non-event alerts that require operator attention.
Community Chimes
Community chimes are camera motion detections from cameras that a site has shared into one of your communities (disarmed-camera "soft" notifications), surfaced here for awareness. For each chime, you can:
- Preview the chime details including any attached images
- Dismiss the chime if it does not require action
- Escalate the chime into a live control-room event. Escalation creates a verified emergency (panic-class, E120) on the chime's site — it enters the normal queue and dispatch flow like any panic, so escalate only when the chime genuinely warrants a response.
Guard Tours
Guard tours are periodic camera check-ins that operators review. For each guard tour entry, you can:
- Preview the camera image and tour details
- View a live stream of the camera
- Dismiss the tour entry if the image looks normal
- Escalate the tour entry if something requires attention. Escalation creates a verified emergency (panic-class, E120) on the tour's site. The new event is named after the tour that raised it — an interval tour becomes "Interval tour escalated" — unless the tour carries a meaningful name of its own.
Dispatches Panel
The Events page also includes a Dispatches panel that shows all active dispatches across your control room. Dispatches are grouped by area and unit, showing:
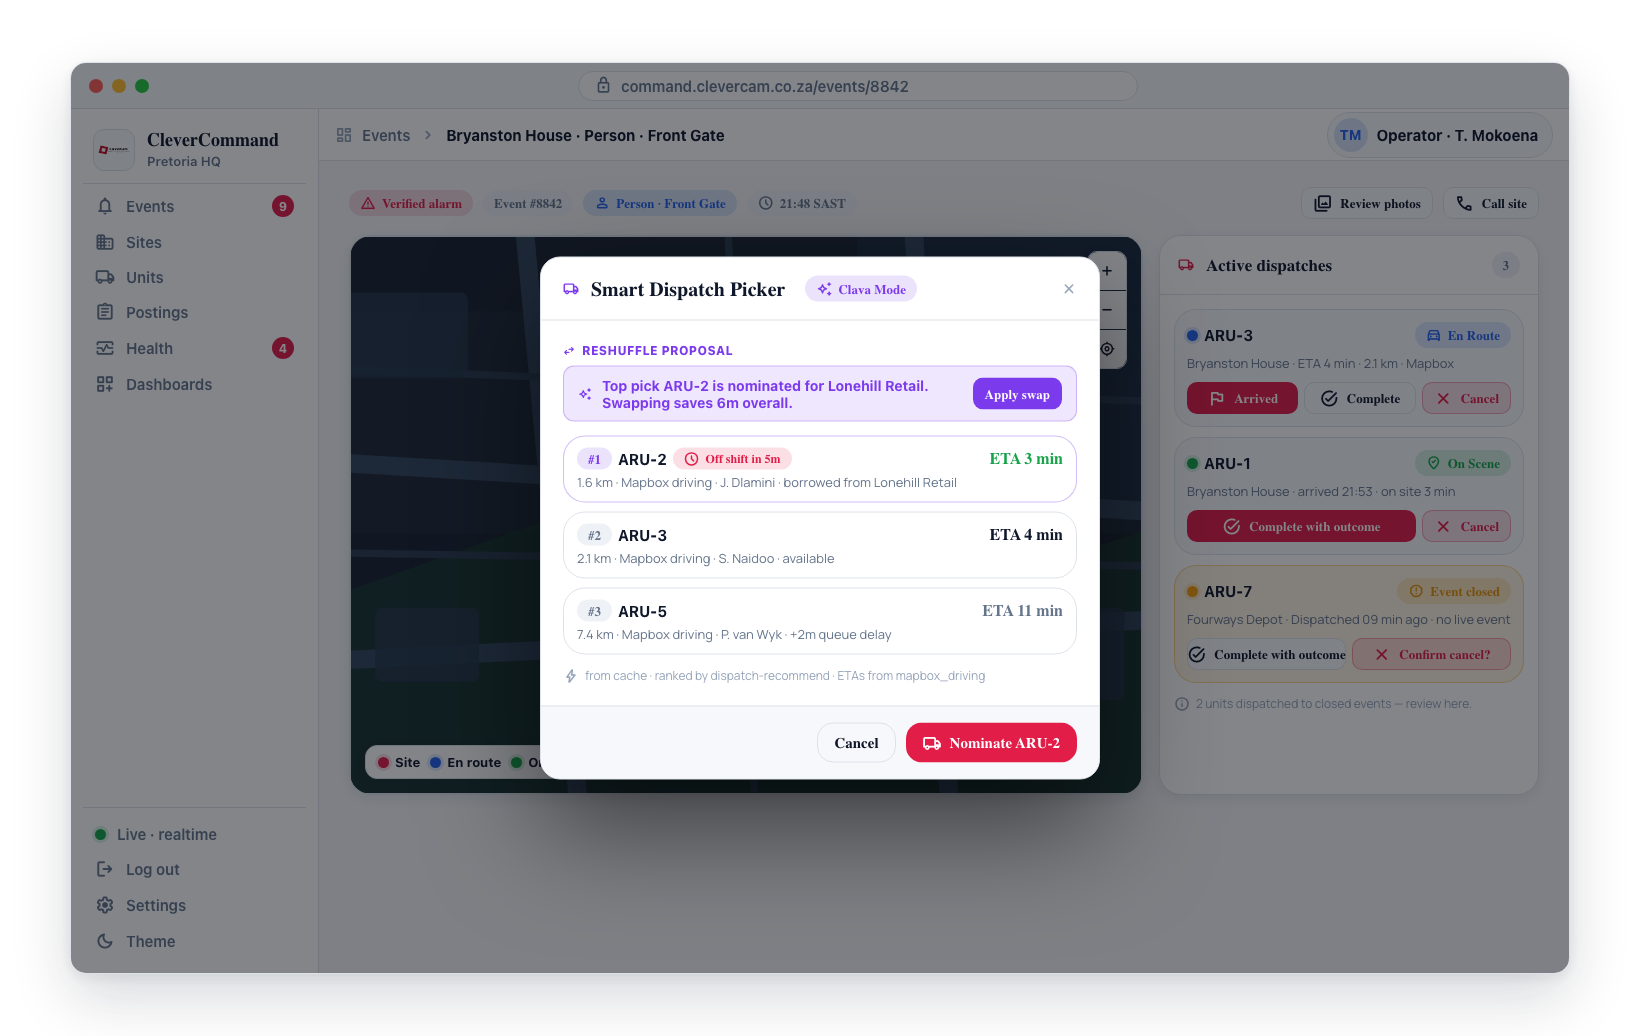
- The unit label and vehicle assignment
- Each dispatched site with its current status (Dispatched, En Route, On Scene)
- Action buttons to mark a dispatch as Arrived, Complete, or Cancel
The dispatches panel refreshes automatically as status changes occur.