Filtering Events
As the event queue fills during busy periods, efficient navigation becomes essential for triage. CleverCommand provides section-based filtering with live counts and a text search to help operators focus on the events that matter most.
Section Filter Chips
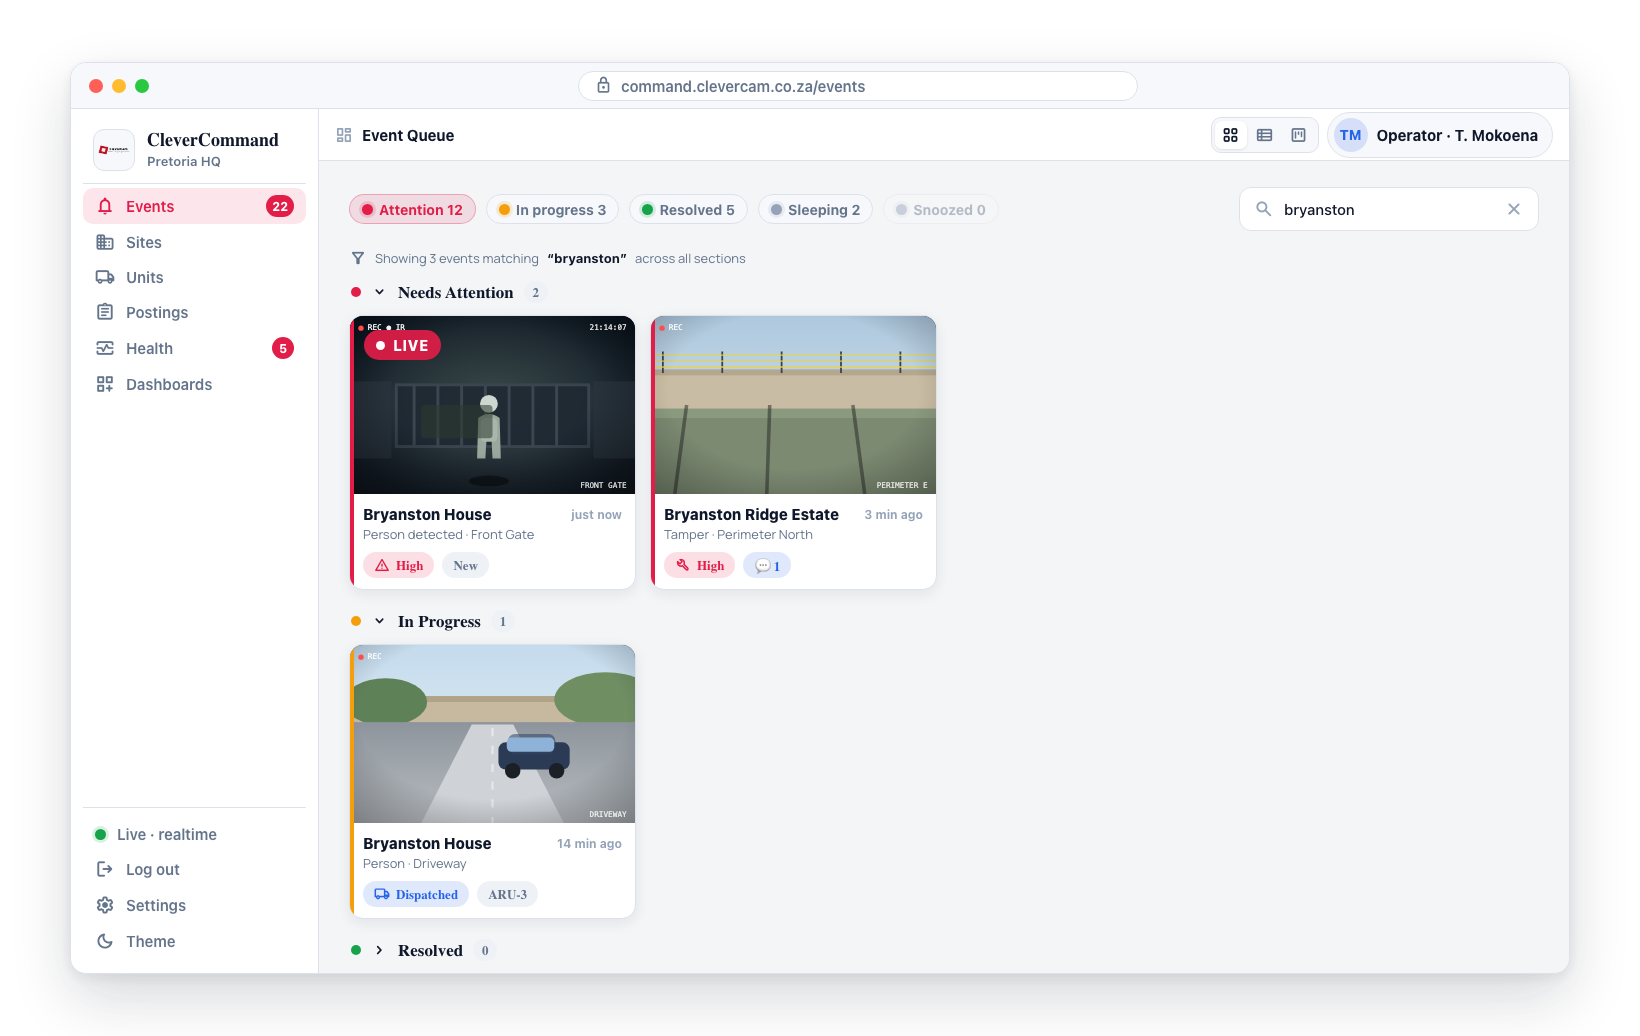
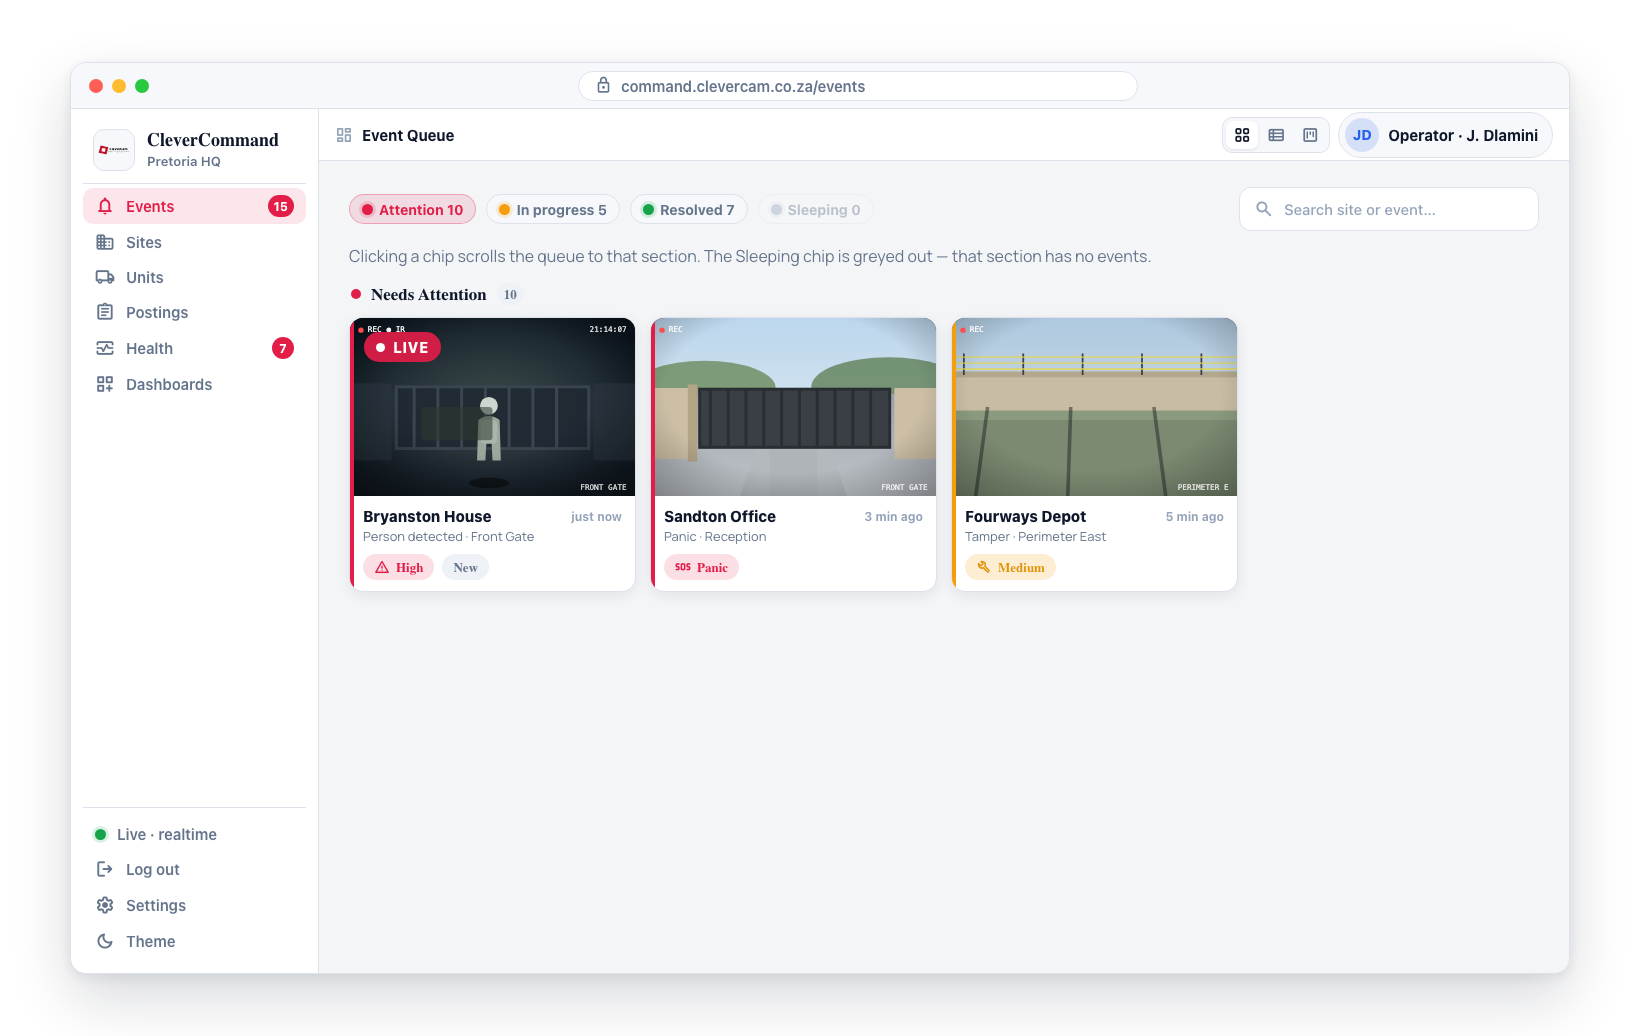
At the top of the event queue, filter chips represent each status section with a live count:
| Chip | Description |
|---|---|
| Attention | Events that need attention (new, unacted-upon events) |
| In progress | Events currently being worked on (opened, dispatched, or arrived) |
| Resolved | Events marked as All in Order or Problem at Site |
| Sleeping | Events that have been put to sleep |
Each chip displays the number of events in that section. Clicking a chip scrolls the queue to the corresponding section. The chips are greyed out when a section has zero events.
During high-volume periods, use the Attention chip to quickly jump to unhandled events. After working through those, click In progress to check on dispatched events.
Search
Use the search function to find events by site name, event type, or title. The search filters the visible queue in real time as you type.
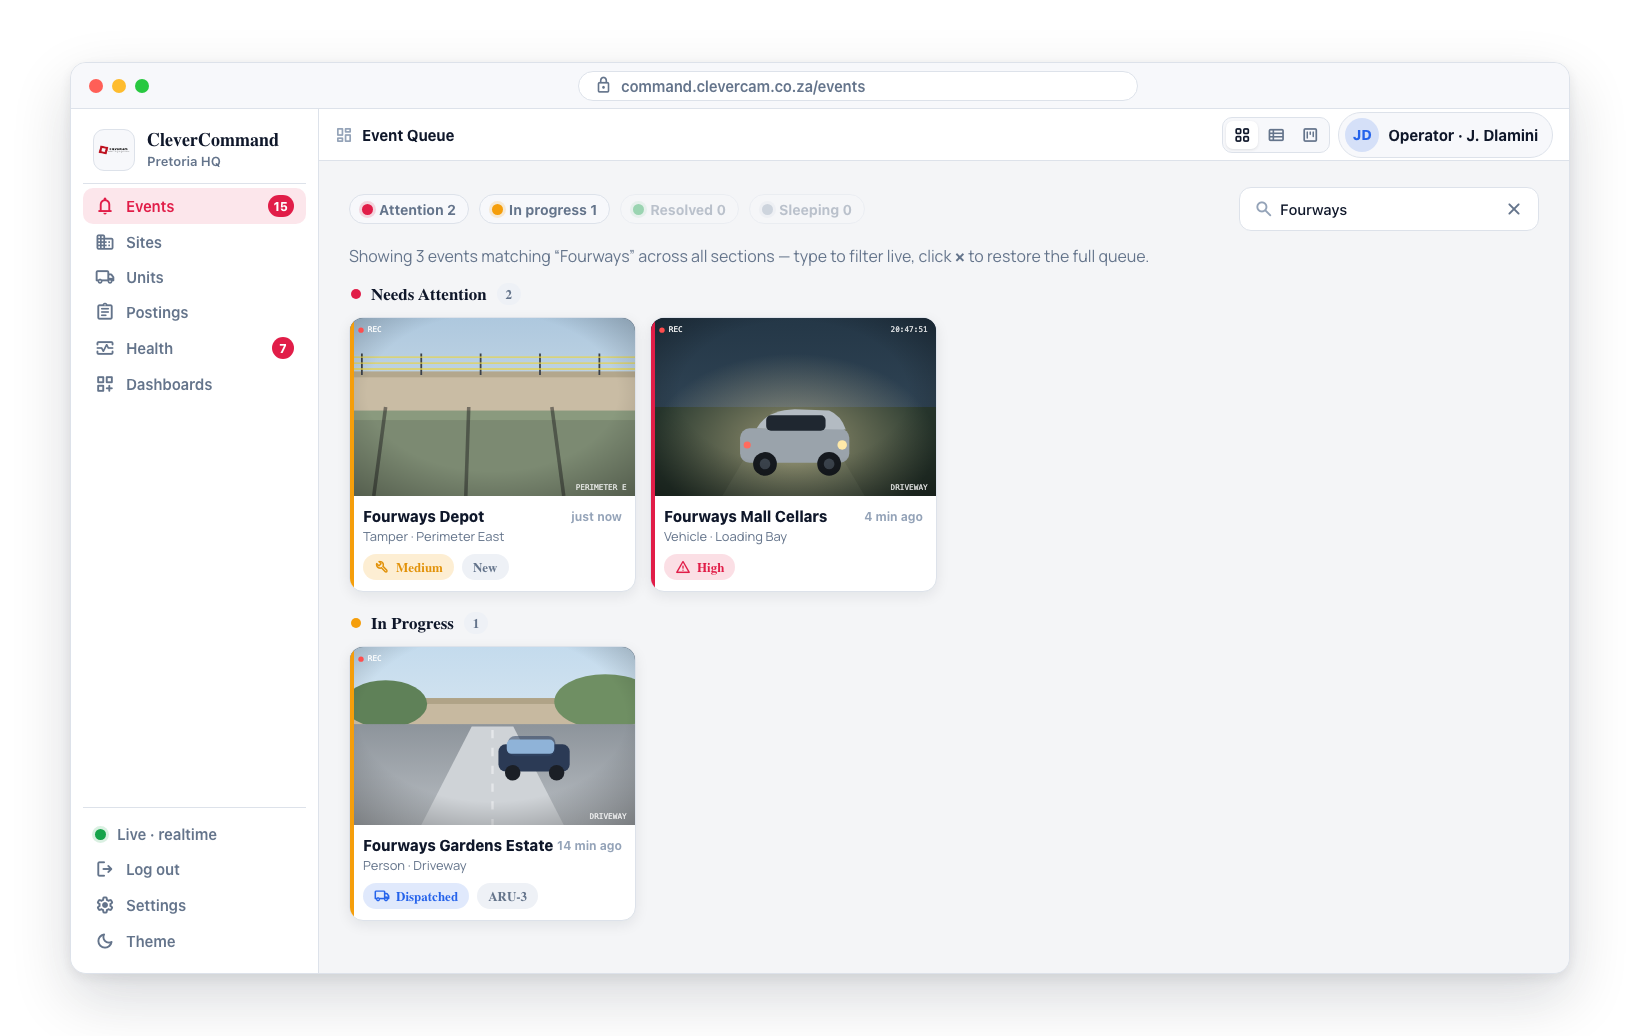
- Click the search field at the top of the queue
- Type your search term (site name, event type, etc.)
- The queue filters to show only events matching your search across all sections
- Click the clear button (X) in the search field to restore the full queue
Area Filter
If your control room uses areas (defined in CleverOps → Areas — see Area Routing for how supervisors assign operators to them), an All areas dropdown appears in the queue header beside the search.
- Open the All areas dropdown in the header.
- Choose an area to show only events whose site belongs to that area.
- Choose All areas again to clear the filter.
The area filter works together with text search and the section chips, so you can focus on one area's events during triage. The dropdown is hidden when no areas have sites assigned.
OVERDUE Filter
If your control room has configured response-SLA timers (see Response SLA and the OVERDUE counter), a ⏱ OVERDUE toggle appears in the queue header.
- Click the ⏱ OVERDUE indicator (its badge shows the current overdue count).
- The queue narrows to only events past their SLA response target, across every stage.
- Click it again to clear and return to the full queue.
This filter combines with text search and the area filter, so you can drill into, say, "overdue events in the North area". It auto-clears when nothing is overdue, and is hidden entirely when no SLA timers are configured.
Collapsing Sections
Each status section in the queue can be collapsed or expanded by clicking its section header. This is useful for hiding resolved or sleeping events to focus on what needs attention. The Sleeping section is collapsed by default.
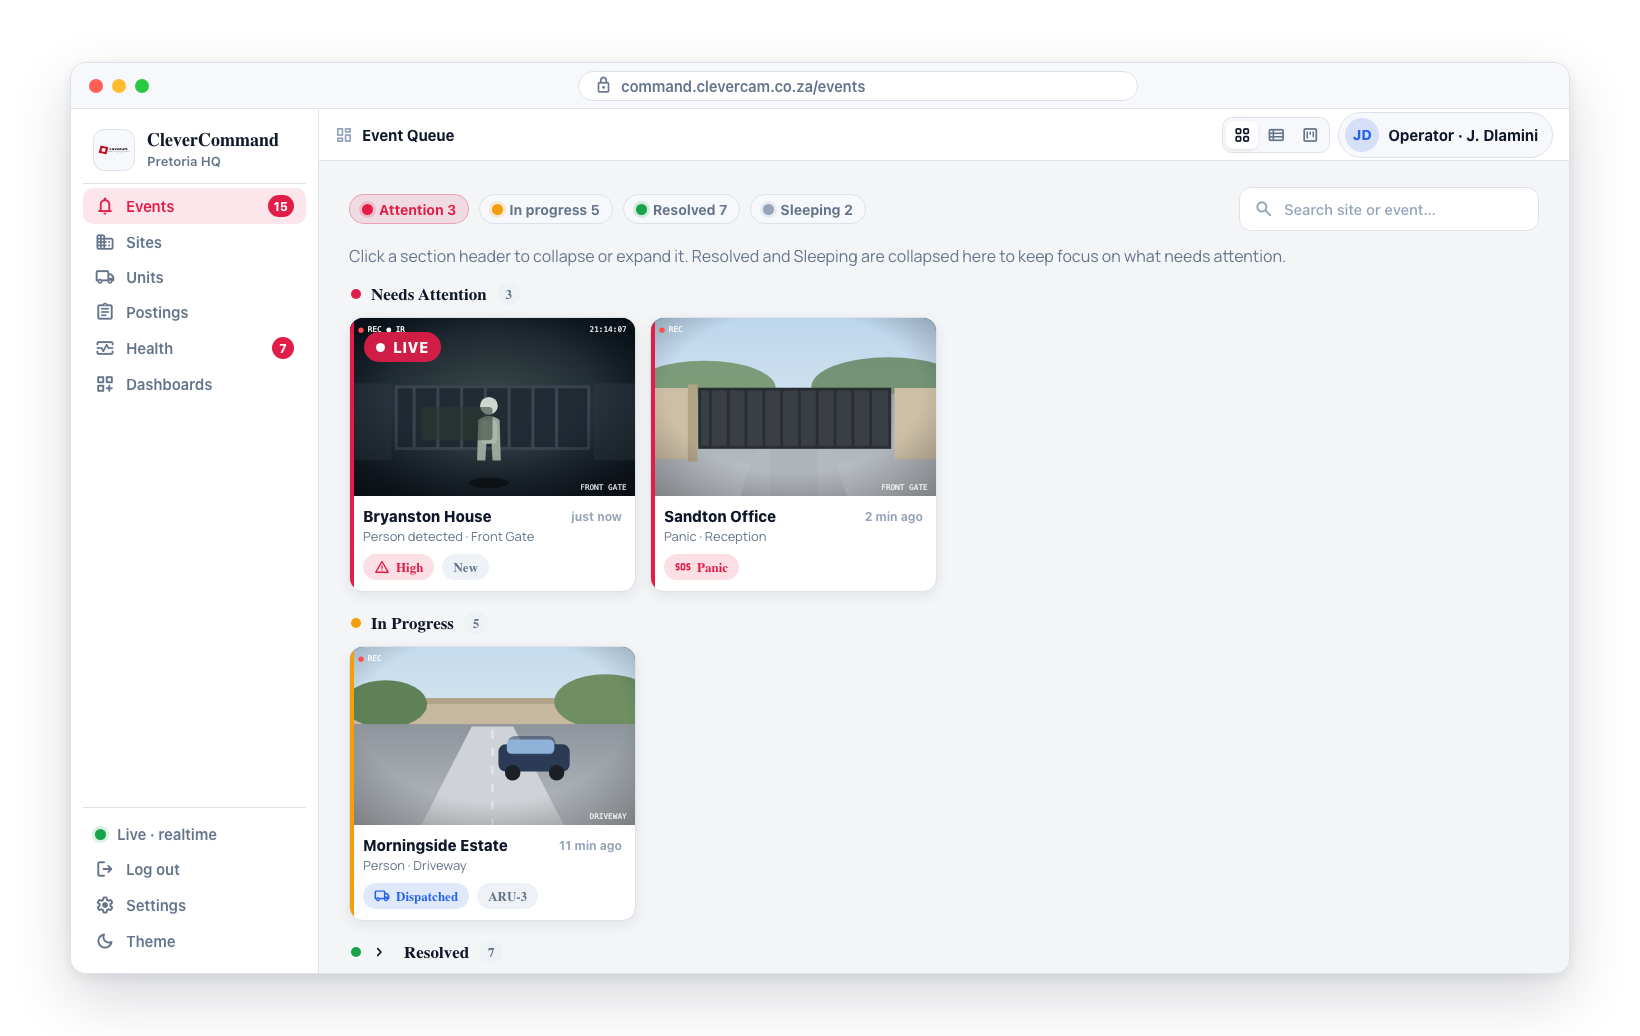
Be mindful of collapsed sections during active monitoring. You may miss new events that move into a collapsed section. Expand sections periodically to maintain full awareness.
Resetting Filters
To clear a search and return to the full unfiltered queue, click the clear button (X) in the search field or delete the search text. Section collapse states persist during your session but reset when you sign out and back in.